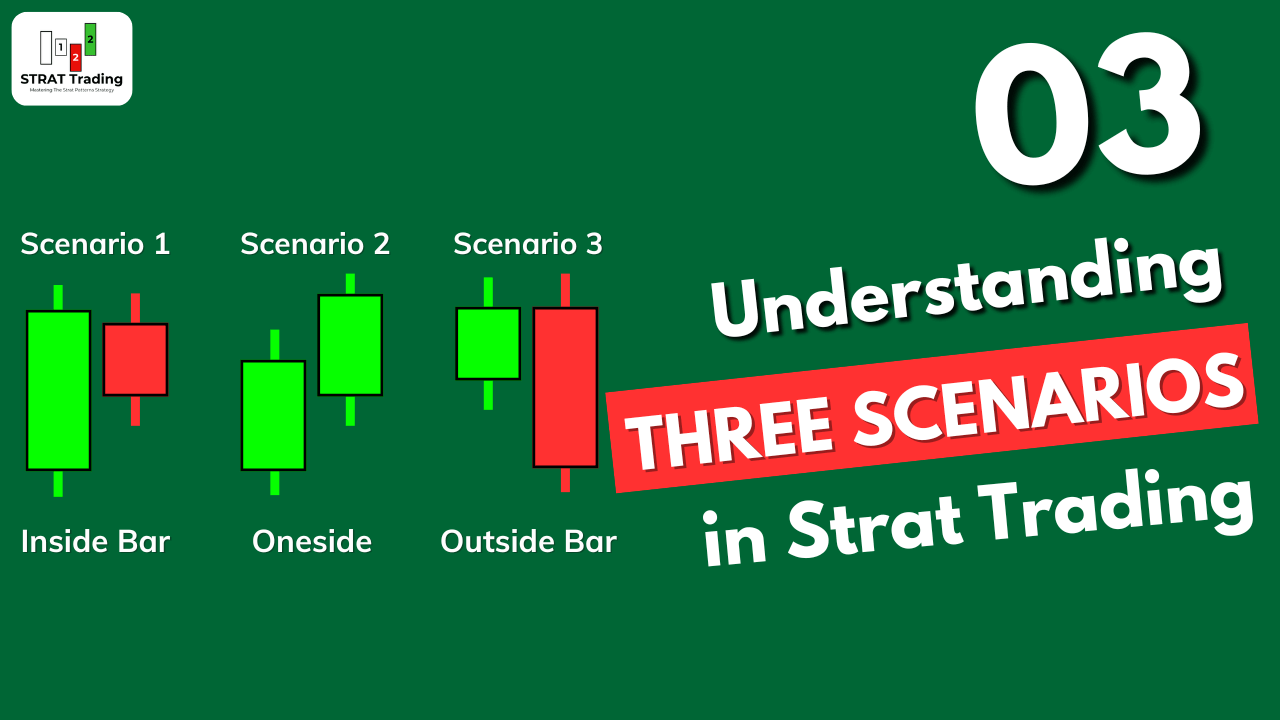
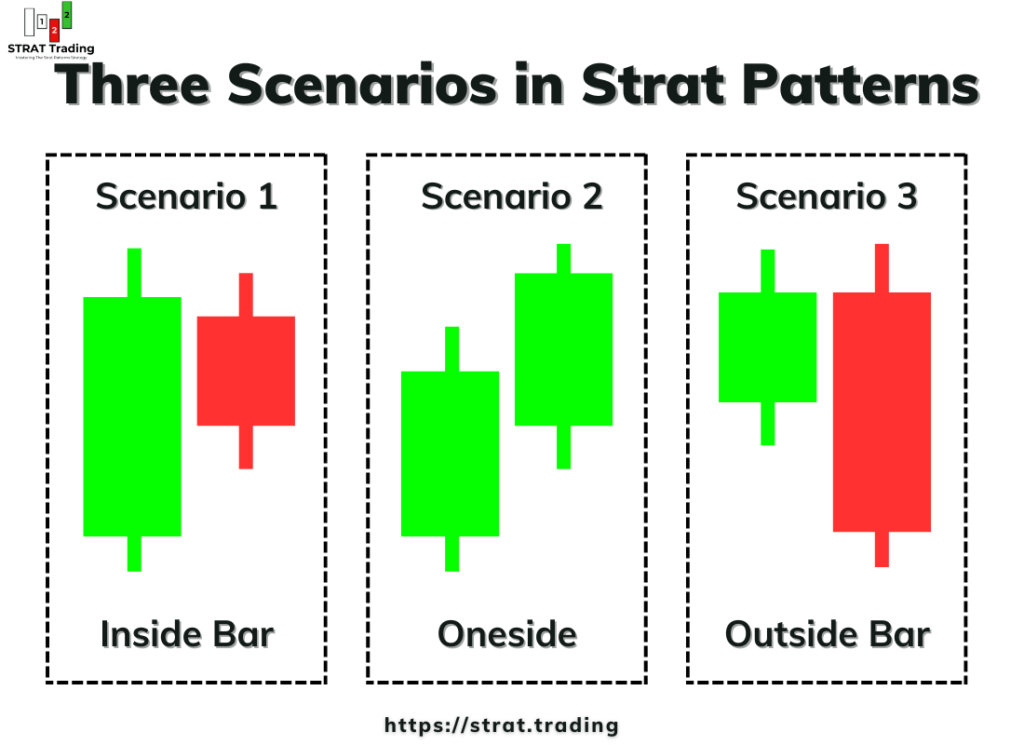
The building blocks of the strat trading are the three scenarios:
- Inside bar
- One side
- Outside bar
These scenarios explain everything about entry, exit and holding a trade. In this article, I will explain these three scenarios through live examples from multiple timeframes and price patterns that make these scenarios.
Understanding these three scenarios is essential for traders because this is the basic concept. If you understand it in depth, it will become easy for you later. If your base concepts are not good, it will become difficult for you later to forecast the market accurately. So, I recommend learning these trading scenarios accurately as much as possible.
What are three scenarios in trading?
The market always makes different patterns. For example, when traders are unsure or the big institutions have not made any decisions, then on the real-time chart, the price makes a pattern of inward price consolidation. The Inward price consolidation shows the indecision.
In the same way, when the price is looking for liquidity and stop-loss hunting, the market makers break the highs and lows to hunt the stop-loss. Moreover, the market creates an expanding price structure.
On the other hand, when the market moves in one direction, either up or down, then this represents the trending conditions, showing that buyers or sellers are dominant in the market.
In the strat strategy, a trader must understand these three price patterns to forecast the market because these are building blocks of the strat trading strategy.
Now, let me explain each scenario in detail.
Scenario 1: Inside Bar
Inside the bar is a candlestick pattern consisting of a big mother candlestick and an inside candlestick. The inside candlestick forms within the range of the mother candlestick.
Within the range means, it will form willin the high and low of previous candlestick.
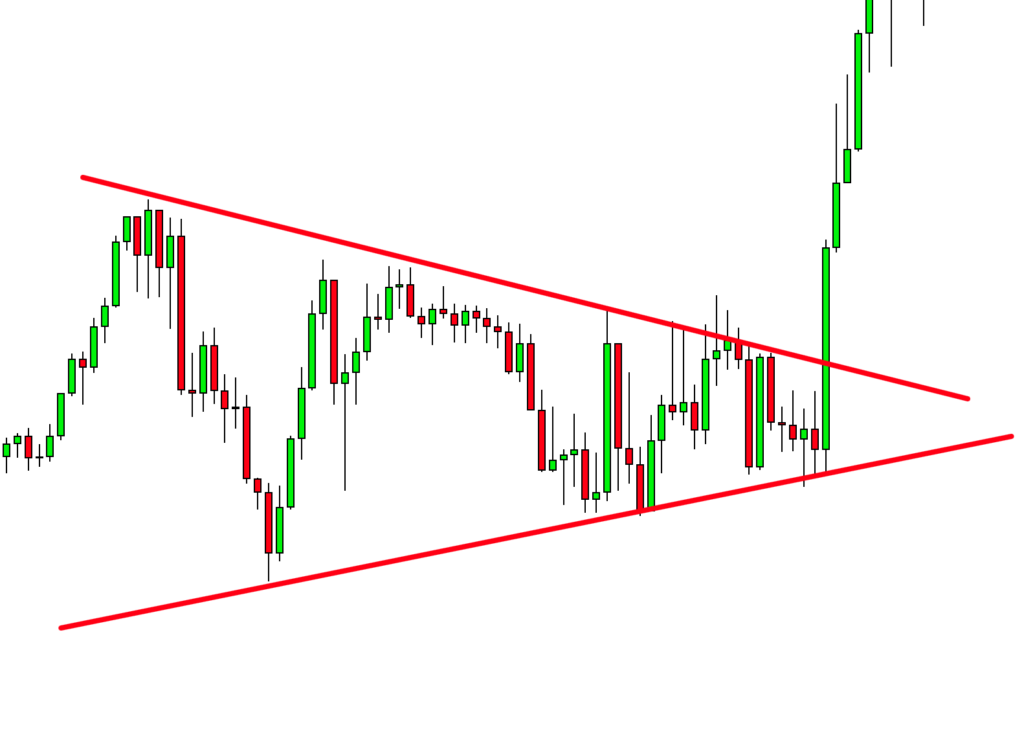
This is the simplest form of scenario 1. However, if we look at a lower timeframe, we will see an inward consolidation price pattern, like in the image below.
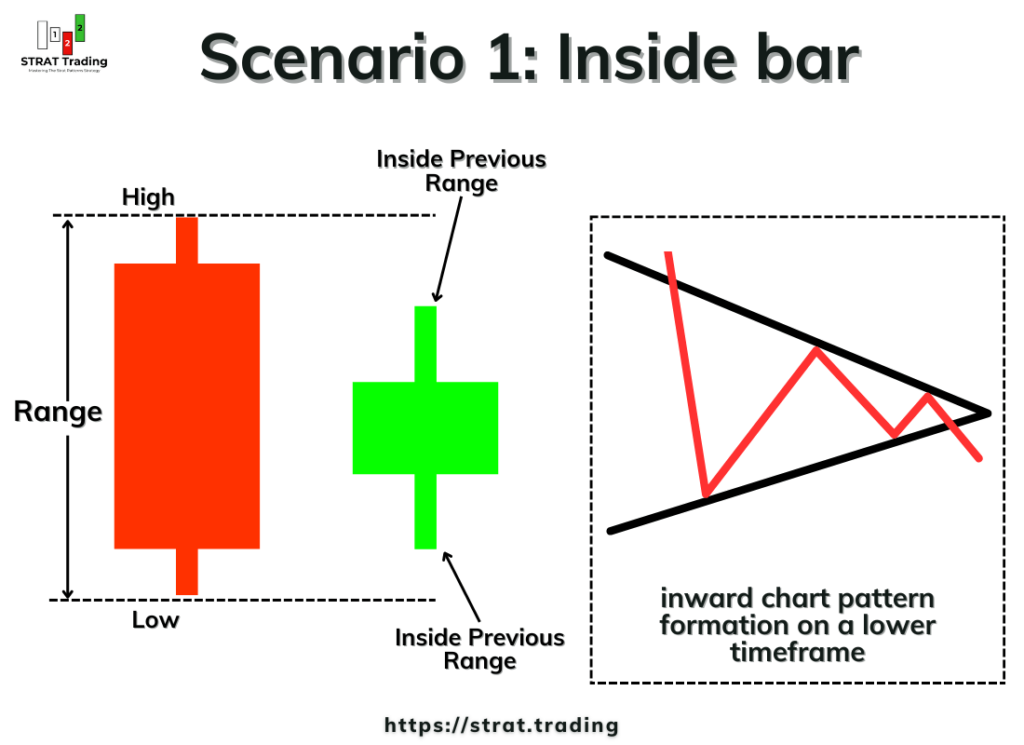
In this pattern, the price does not have a bullish or bearish trend but consolidates inward. Each progressive wave of price is smaller than the previous wave.
So, if you found the inward chart pattern on a lower timeframe or an inside bar candlestick pattern on a higher timeframe, then the meaning and sense of both patterns will remain the same.
What does the inside bar represent In the real markets?
Market makers constantly analyze the market conditions to maintain profitability and liquidity.
Let me explain step by step.
The big mother candlestick can be seen as a big trending candlestick that market makers are selling or buying. Price is moving in one direction. Now after this big buying or selling, they will take a pause to make the next decision, like whether to continue in the previous trend or reverse the trend, depending on liquidity and profitability.
When the market makers are in this phase, an inside candlestick forms, we also learn that they are now in an indecision phase, and the breakout of an inside candlestick will decide whether they will continue or reverse.
So inside the bar is scenario one, which shows us the market pause or indecision. We can use this market pattern for trade entry or exit because big decisions are made during this scenario.
Scenario 2: One Side
One side means price aggregates only in one direction. Price breaks only one side of the range of the previous candlestick.
When a bullish candlestick breaks the high of the previous candlestick, a higher high forms, and then scenario two forms. On the other hand, when a bearish candlestick breaks the low of the previous candlestick, making a new lower low, then again, scenario 2 meets.
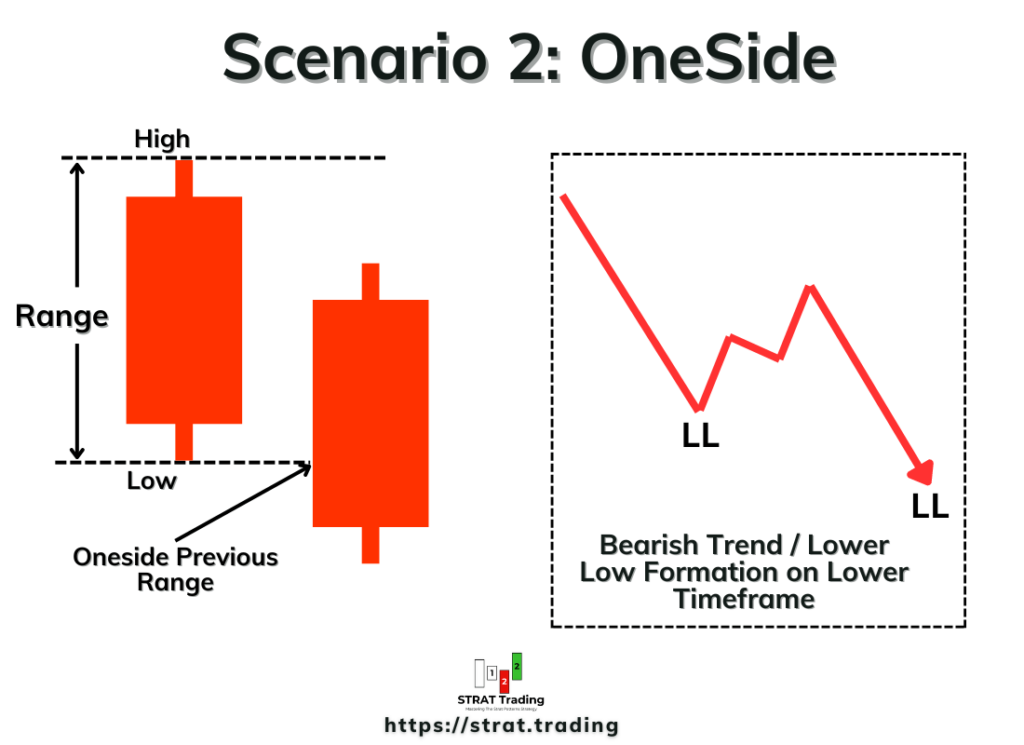
In simple words, One Side Scenario 2 represents the trending market conditions, either bullish or bearish.
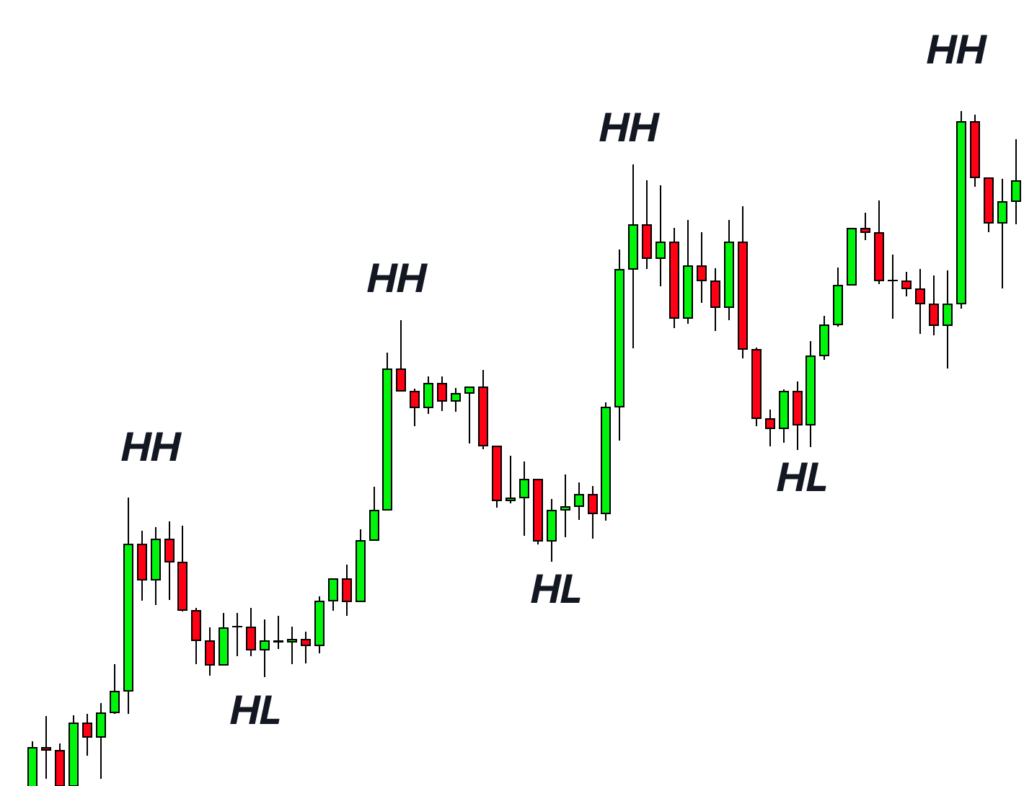
This is an important scenario because it helps to hold a trader longer or add to the previous position to increase the reward or profit in a trade. For example, during a bullish trend, a series of higher highs form, and we can keep on adding more buy positions on each higher high formation until a reversal happens. This will significantly increase the profit of a trade.
The activity of traders during scenario 2
During the bullish trend, market makers Are buying, or their buy orders are fulfilled. During the bearish trend, market makers are selling, or their sell orders are fulfilled.
Also, retail traders buy or sell during solid trending conditions due to fear and greed.
So, the best way is to stay in the direction of institutional traders.
Keep adding more positions and break even the previous ones to trade risk-free.
The scenario is mainly used for scaling trade and trade management.
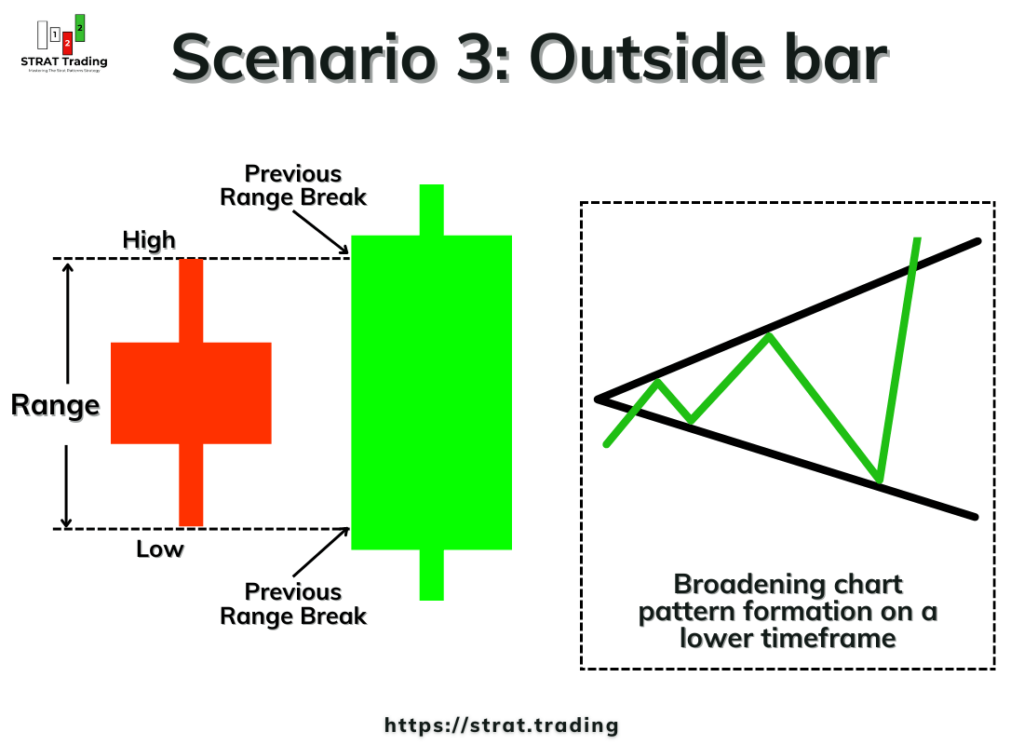
Scenario 3: Outside Bar
The outside bar is a pattern in which the price expands its range, breaking the highs and lows of the previous candlestick range. It is the opposite pattern to the inside bar.
The third scenario is the most important and complex to understand. I believe this is the origin of market makers’ strategy, and every market’s price chart has an outside bar pattern in different timeframes.
The outside bar is also a candlestick pattern on a higher timeframe and a broadening chart pattern on a lower timeframe. A broadening pattern means the price will expand from a specific price, and each successive wave will be bigger than the previous wave. So, if you find an outside bar candlestick pattern on a higher timeframe and a broadening pattern on a lower timeframe, then both are the same.
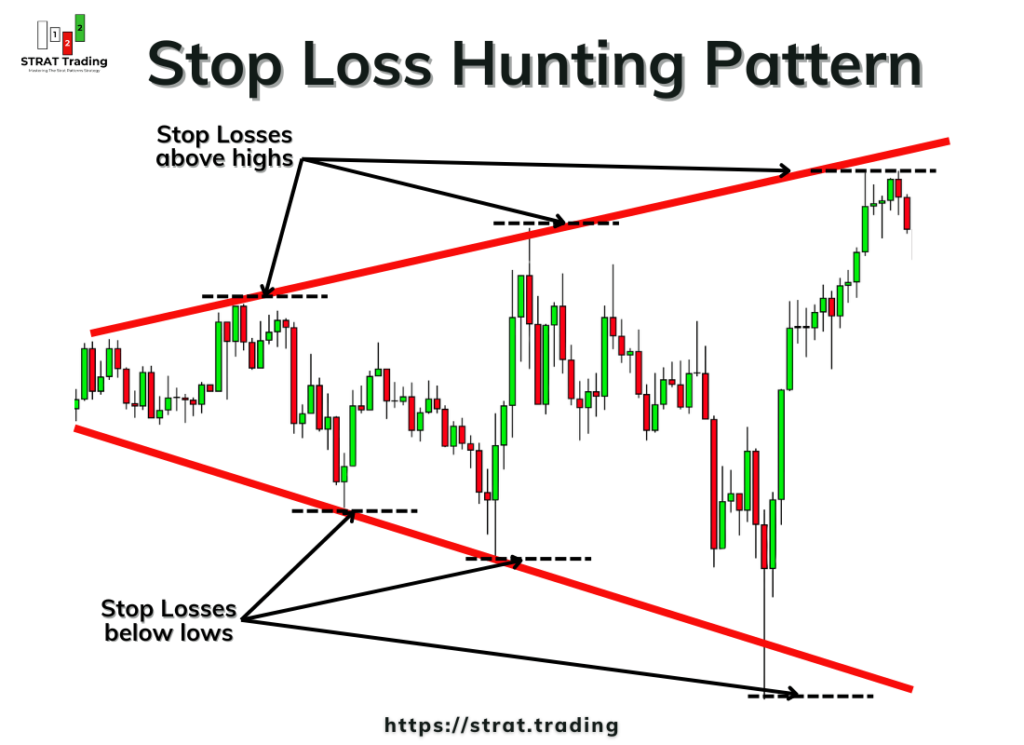
Market makers use the broadening pattern in the stop-loss hunting strategy because it continues breaking previous highs and lows.
Stop-loss hunting and high volatility
The outside bar pattern represents the high volatility in the market and is also a sign of a major trend reversal.
It is also a stop-loss hunting pattern by institutional traders because they will continue breaking the highs and lows of previous ranges, hitting a lot of stop losses of retail traders. This creates liquidity, and after enough liquidity and keeping the retail traders out, market makers start a new trend. So understanding this pattern is very important in trading.
The outside bar pattern mostly helps in exiting a trade. If you are holding a trade and an outside bar pattern forms, you should close your trade and take profit.
I hope you can now get an overview of the three scenarios in strat trading. After practicing, continue learning the strat and with time you’ll understand these market patterns completely.
How do we apply the strat scenarios in trading?
After learning the three scenarios, the next step is to apply them accurately on the live chart; however, you must understand that we cannot trade these scenarios alone. These market patterns tell us the next move of market makers.
However, for a complete trading strategy, we also learn timeframe continuity, higher timeframe analysis, actionable patterns, and many other things that can make us profitable traders. So, at this step, you must know about the psychology behind each scenario.
Inside bar: This pattern represents that the market is in the indecision phase and has no direction or trend. Price will turn or continue after this pattern.
One side: This pattern shows that the market is bullish or bearish. Price will continue its previous trend.
Outside bar: This pattern shows that the market is expanding and will soon experience a big trend reversal. There is no direction or trend in the market.
The bottom line
A trader should first learn the basic market scenarios to forecast the market logically. These market patterns alert a trader about the future, and then a wise trader can make good decisions.
So, practice these three market scenarios at least 100 times each and then analyze them. I am sure you will find the key to the treasure.
I would love it if you would ask me questions in the comments below. Your questions can also help beginner traders, with the stuff they are wondering about but have not asked yet.
So ask questions, and let’s become better traders by helping each other.