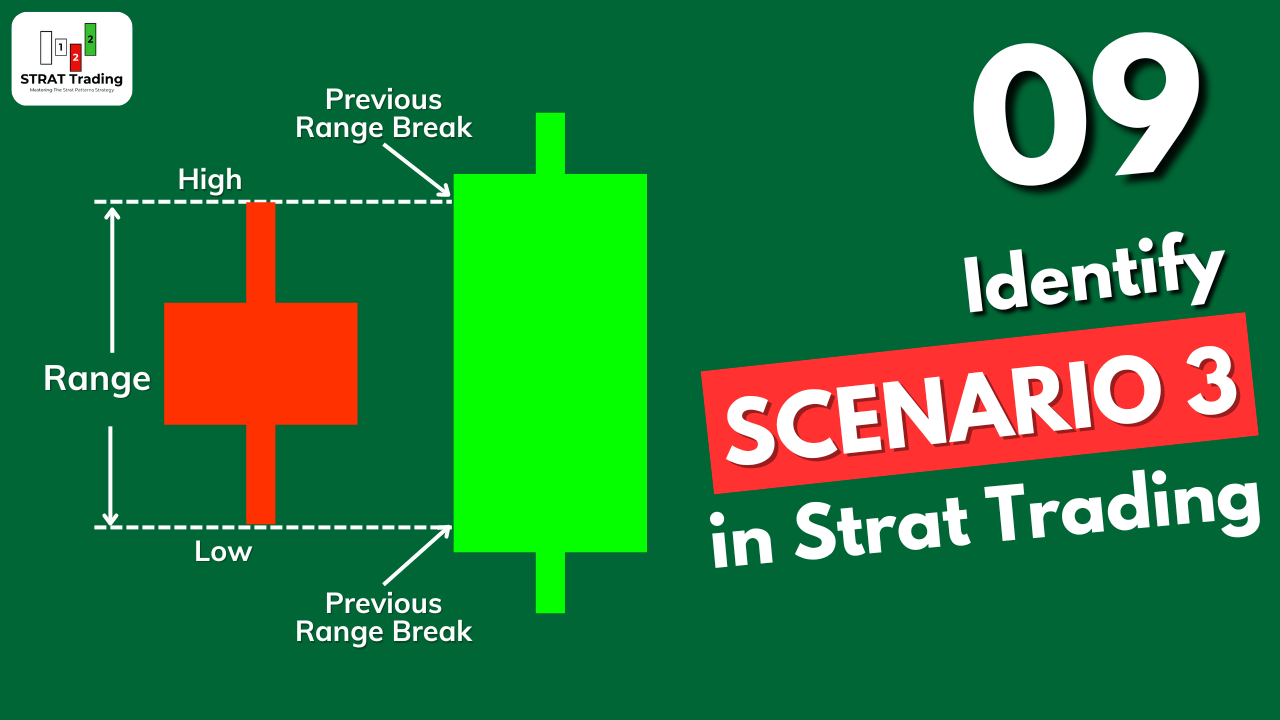
When the current candlestick takes out both sides of the previous candlestick, then it means scenario 3 has been formed on the chart. It is also known as the engulfing pattern or outside bar in trading.
In the strat patterns, scenario 3 tells about the expansion of price range and a major trend reversal. The price forms a broadening pattern on the chart. It also gives information about the trade entry, exit, and profit magnitude on the price chart.
Understanding scenario 3 is compulsory because it will help a lot to make good decisions in trading and also to avoid market maker’s traps. So make sure to read the full article without skipping any step.
How to identify scenario 3 on the chart?
A candlestick consists of a high and low price. Price moves forward by breaking either the high or low of the previous candlestick. However, if it breaks both sides, making a sideways and broadening market structure is called scenario 3.
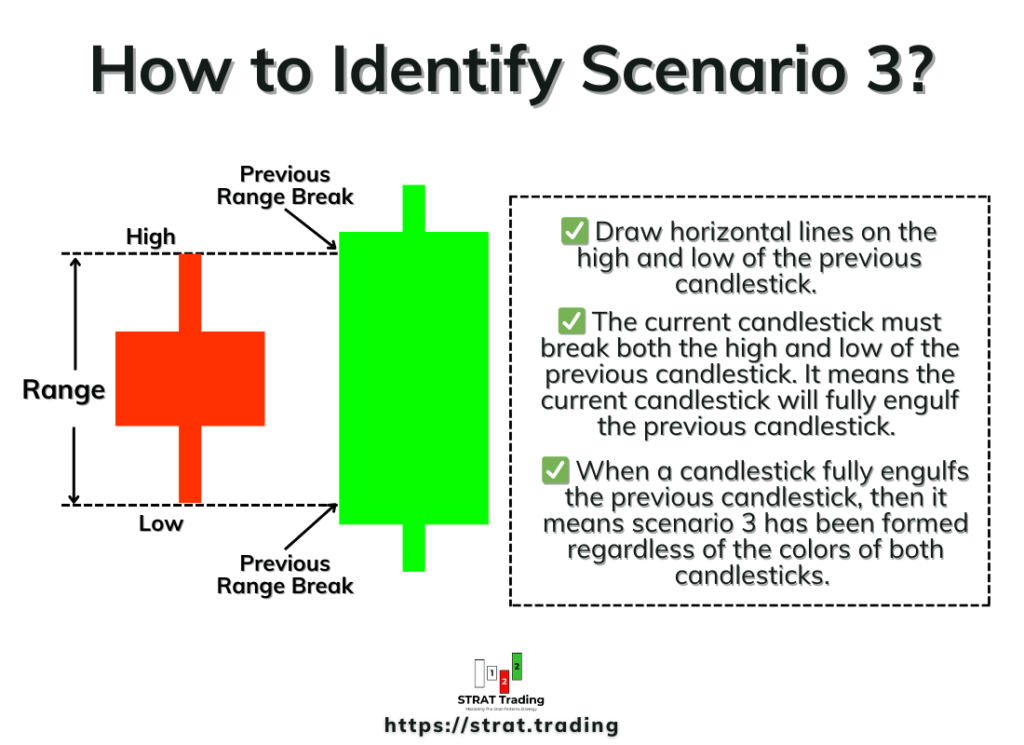
Here are the few steps that you must follow to identify the scenario 3 accurately on the chart:
- Draw horizontal lines on the high and low of the previous candlestick.
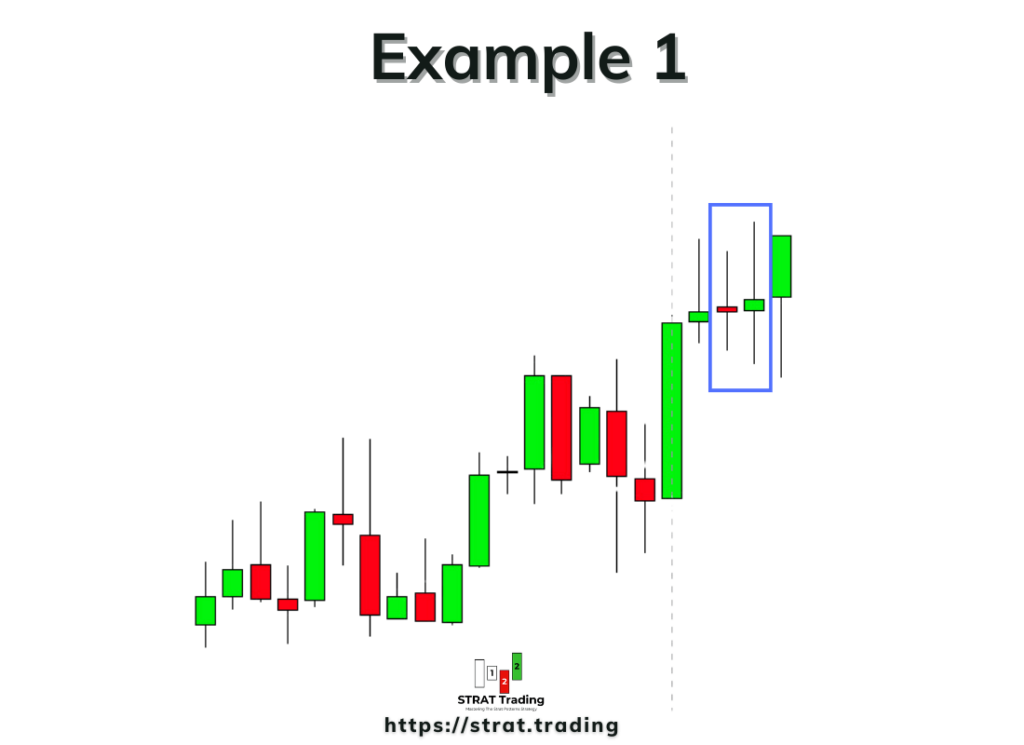
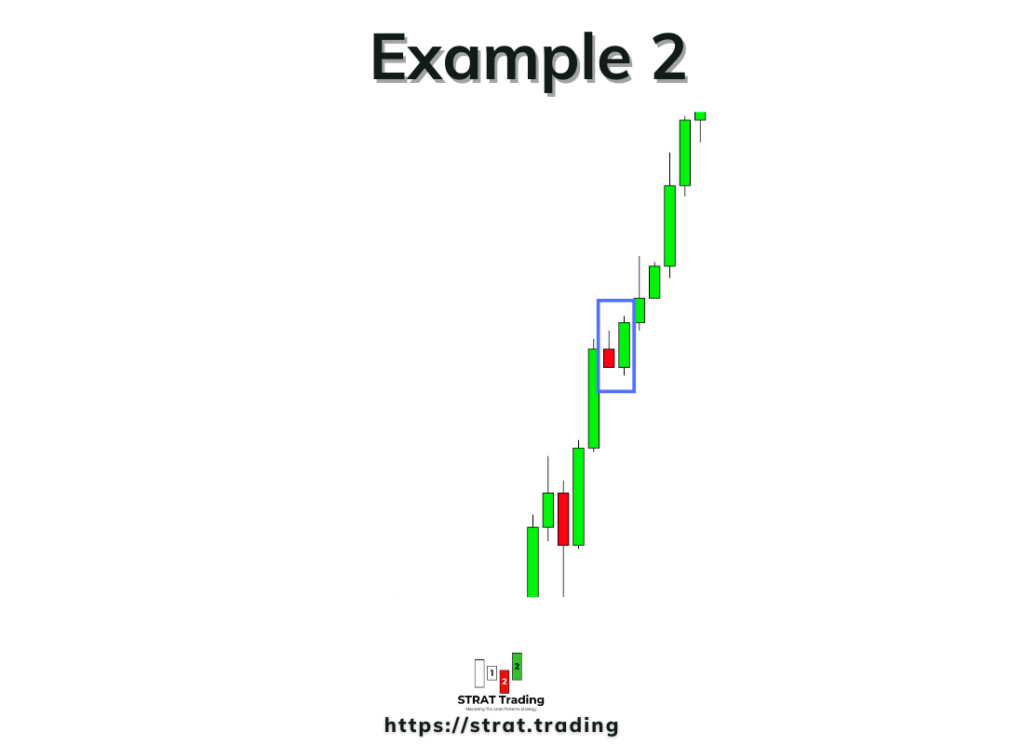
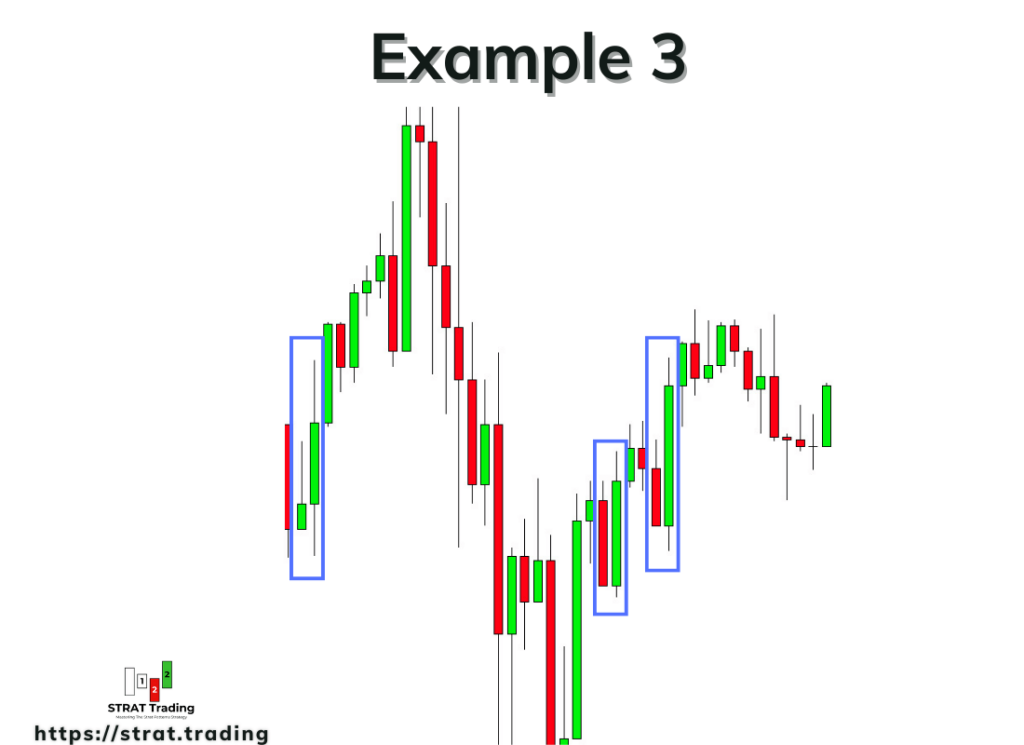
- The current candlestick must break both the high and low of the previous candlestick. It means the current candlestick will fully engulf the previous candlestick.
- The color of both candlesticks does not matter in scenario 3. When a candlestick fully engulfs the previous candlestick, then it means scenario 3 has been formed regardless of the colors of both candlesticks.
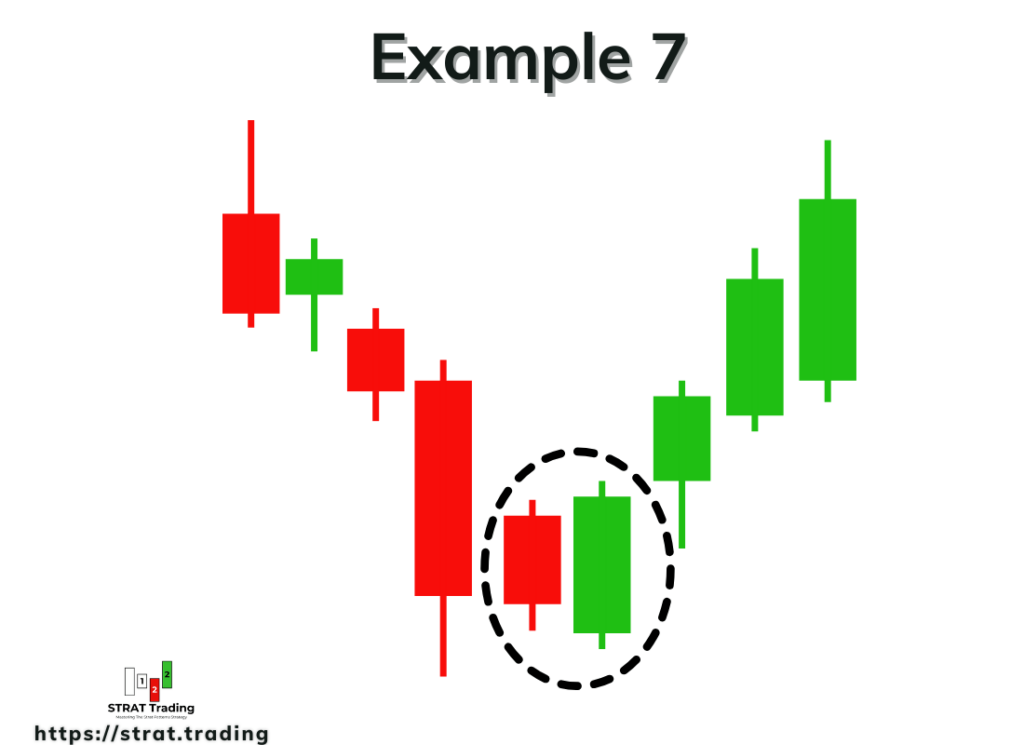
However, you should keep in mind that If bullish engulfing forms at the end of a downtrend, then chances of a trend reversal from bearish to bullish are very high. On the other hand, if bearish engulfing forms at the end of the uptrend, then the chances of a trend reversal from bullish to bearish are very high.
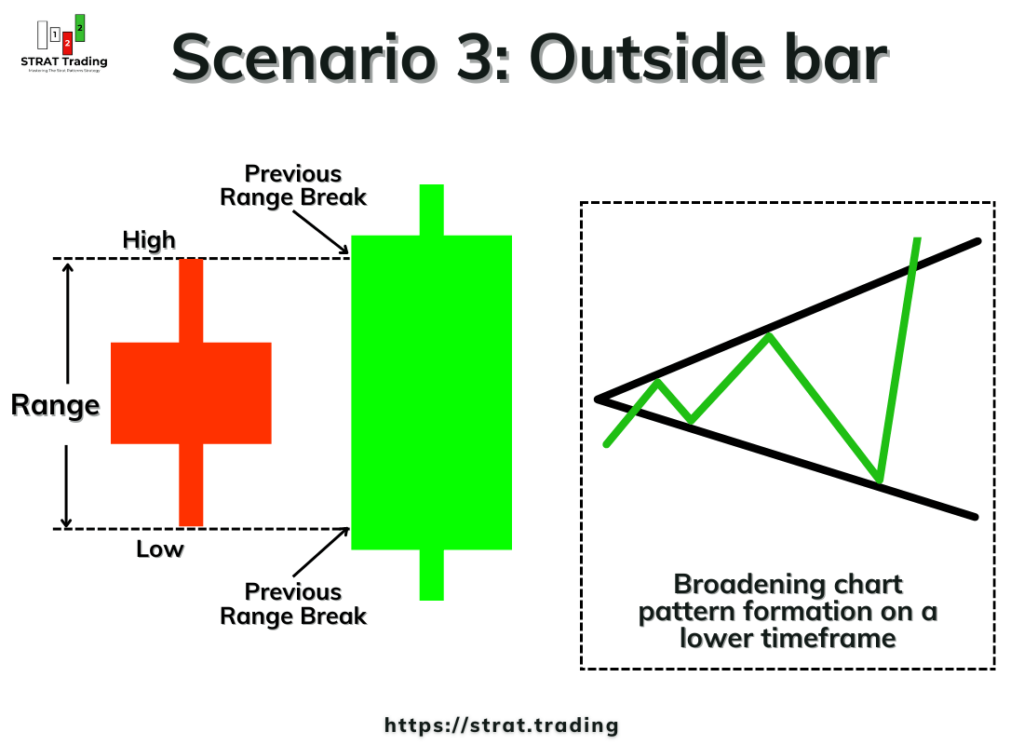
Structure of Scenario 3 pattern on lower timeframe
On higher timeframes, the formation of the engulfing pattern is a direct indication of the scenario 3 pattern. However, we can also determine scenario 3 using the price waves on lower timeframes. It is a bit advanced concept for traders.
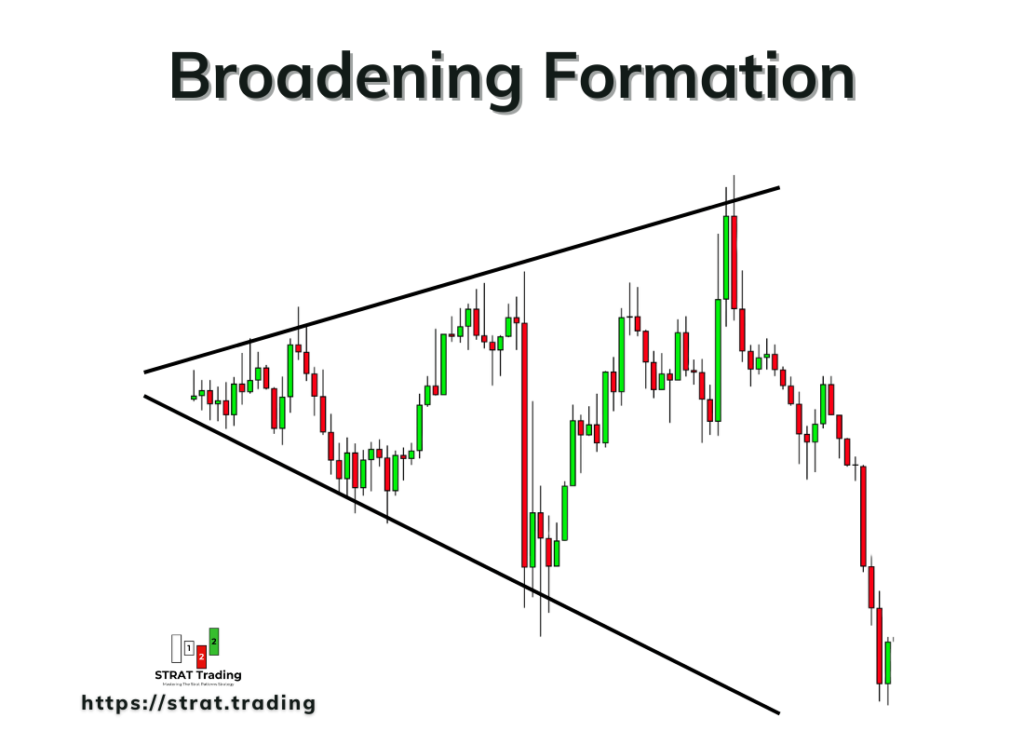
When we switch to a lower timeframe, then we will see a broadening pattern formation. Each successive wave is bigger than the previous wave. This broadening formation also represents scenario 3. Look at the image below for a better understanding of this pattern.
Usually broadening pattern forms before a big trend reversal.
Purpose of scenario 3 in the strat strategy
The major purpose of scenario 3 pattern in the strat trading is to avoid the market maker’s stop loss hunting. When the market breaks the previous highs and lows without any trend, then in reality, they are hunting the stop losses of retail traders so they can make a trend later.
However, we can also use scenario 3 in the following cases
- To find when to enter a trade and when to remain out of the market.
- To find the take profit level or exiting a live trade.
- To find the major trend reversals in the market.
When the price is in the sideways range, making an expansion, then we should always stay away from the market. We should not open a trade in the choppy market conditions.
The broadening formation in scenario 3 also tells about the magnitude of a trade. After drawing trend lines, we can find the magnitude of a trade setup and hold a trade longer to get maximum profit.
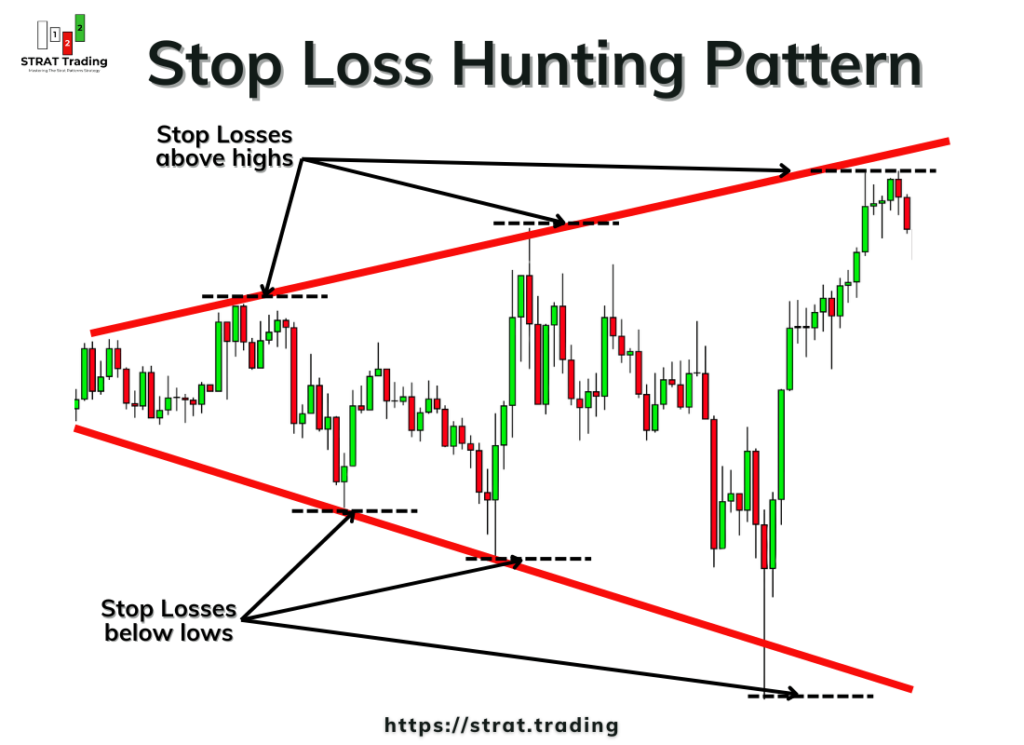
Please check the image above to see how we can draw the trendlines by joining the highs and lows of the broadening pattern. These trendlines will, in turn, give us the high-risk reward take profit levels on the price chart.
When you see a broadening formation on the chart, then it is a confirmed indication of a big trend reversal. But before a major trend reversal, market makers will try their best to break the previous highs and lows to keep the retail traders out of the market before starting a major trend because they don’t want you to ride big market trends. A broadening pattern is also known as a stop-loss hunting pattern in trading.
I hope you will come to know the importance of this scenario in the strat patterns. Now, let me show you some examples.
Examples
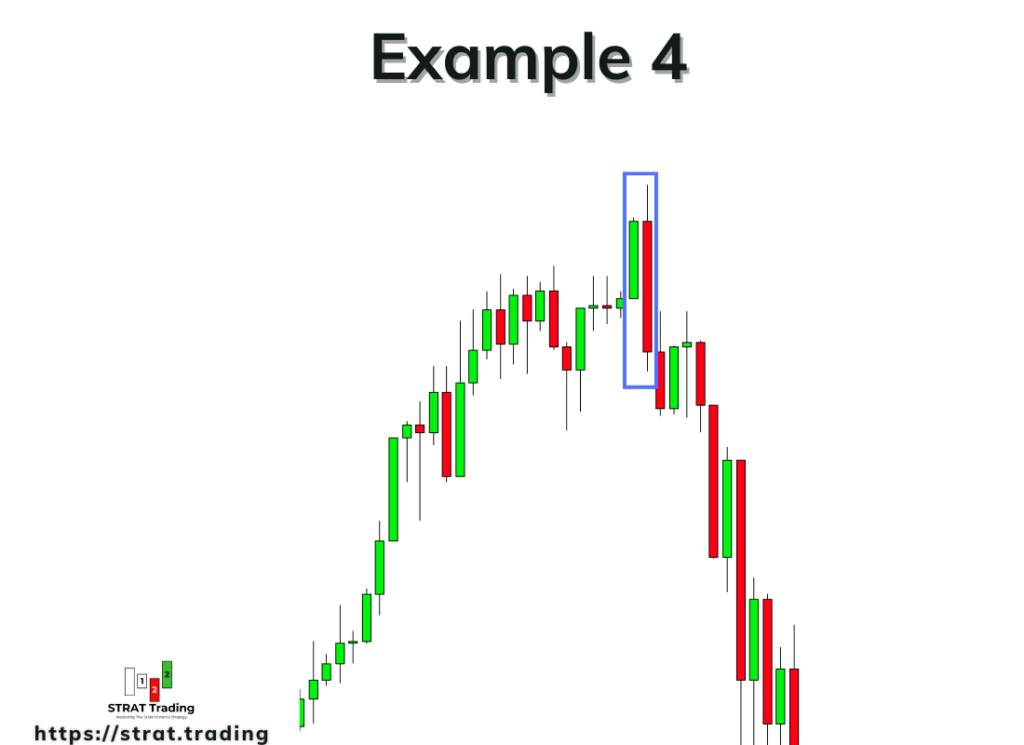
Here are a few examples that you should observe to find the scenario 3 pattern accurately on the candlestick chart.
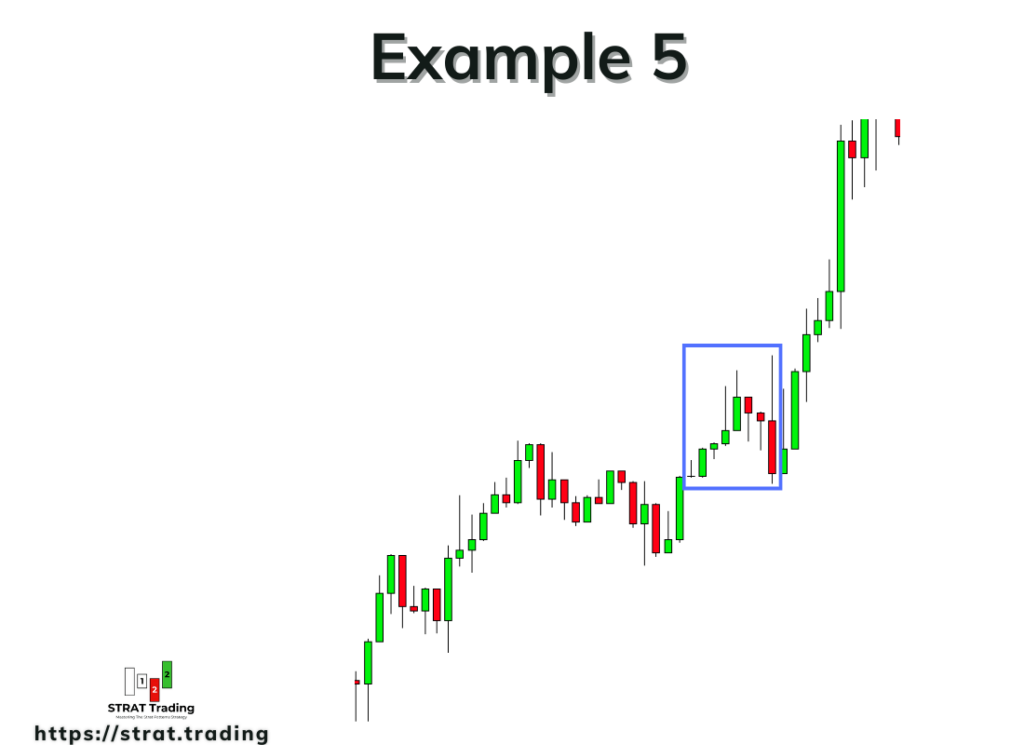
Also, check this example 5, where the red candlestick has engulfed the highs and lows of the previous 7 candlesticks.
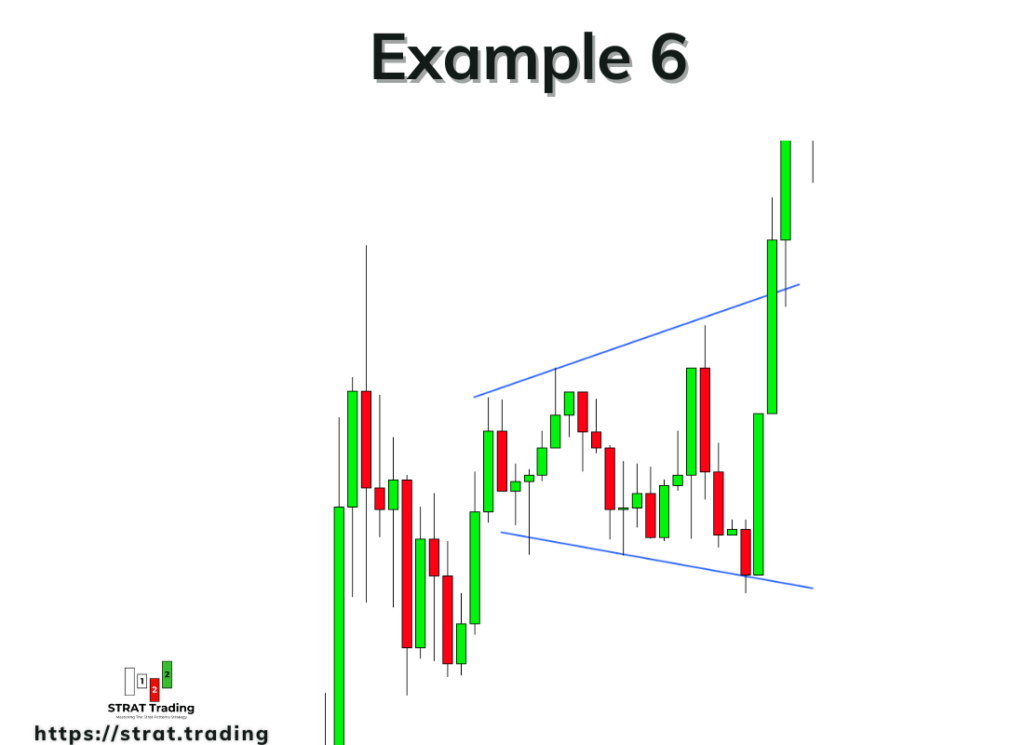
Example 6 shows the lower timeframe view or structure of scenario 3.
Conclusion
The bottom line is that success in trading lies in knowing the way of market makers and trading with the market makers. If you’re not following the big guys, then you’ll end up losing trading accounts again and again.
However, if you follow proper methods like in the strat patterns, then you can become a successful trader. It’s not an easy path, but it’s possible.
I will highly recommend you spend as much time as possible practicing scenario 3 on the candlestick chart. Because I think it’s the most important chart pattern in trading, and most traders ignore it.
Take at least 100 screenshots from the history of any currency pair and then analyze those screenshots one by one. Then, try to filter out screenshots with high-probability trade setups.
If you have any questions, please comment in the section below, and I will try my best to answer your query related to the strat patterns.