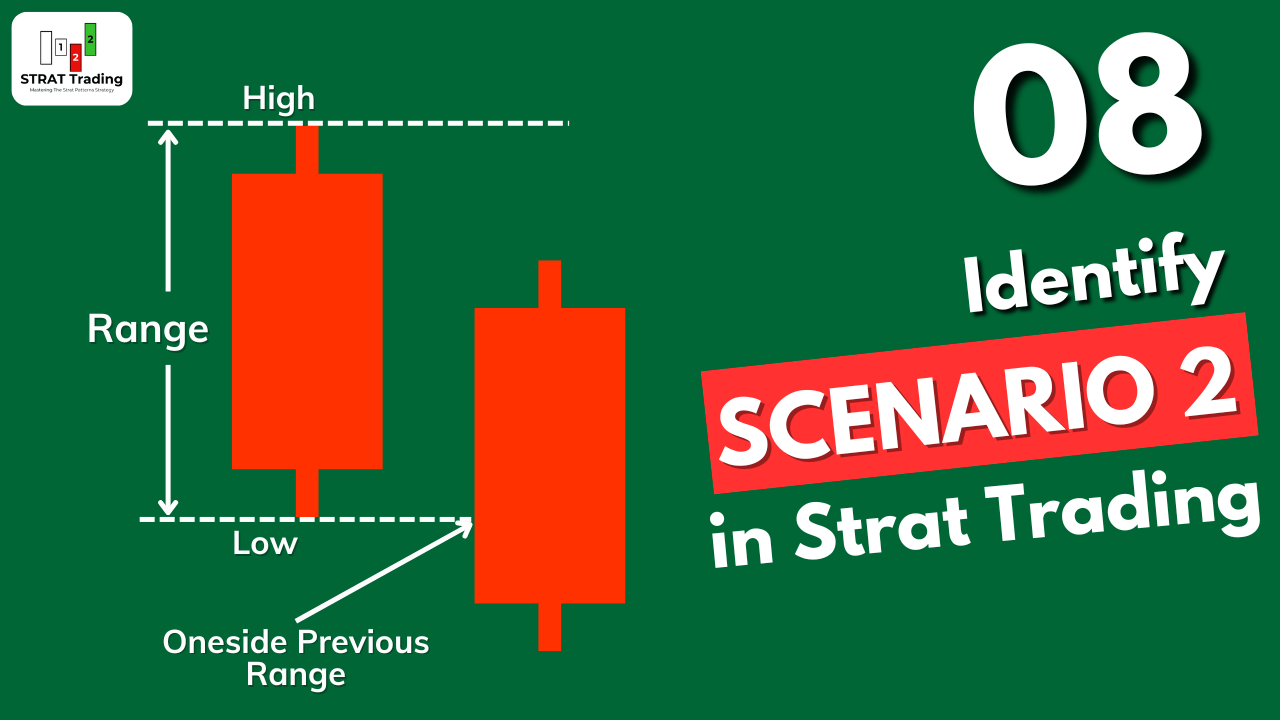
When only one side of the previous candlestick is taken out by the current candlestick, scenario 2 on the chart occurs. This scenario shows the market trend.
From the three scenarios of the strat patterns, scenario 2 tells us about the market’s trend, either bullish or bearish. When both candlesticks are bullish, the price is making higher highs with a bullish trend. On the other hand, when both candlesticks are bearish, it means the price is making lower lows with a bearish trend.
Let me explain scenario 2 in detail, so read the full article without skipping any step.
How to identify scenario 2 in the Strat Trading?
Finding scenario 2 is simply a representation of a bullish or bearish trend on the candlestick chart.
Here are the few steps that you should follow to find scenario two on the chart correctly:
Scenario 2 for bullish candlesticks
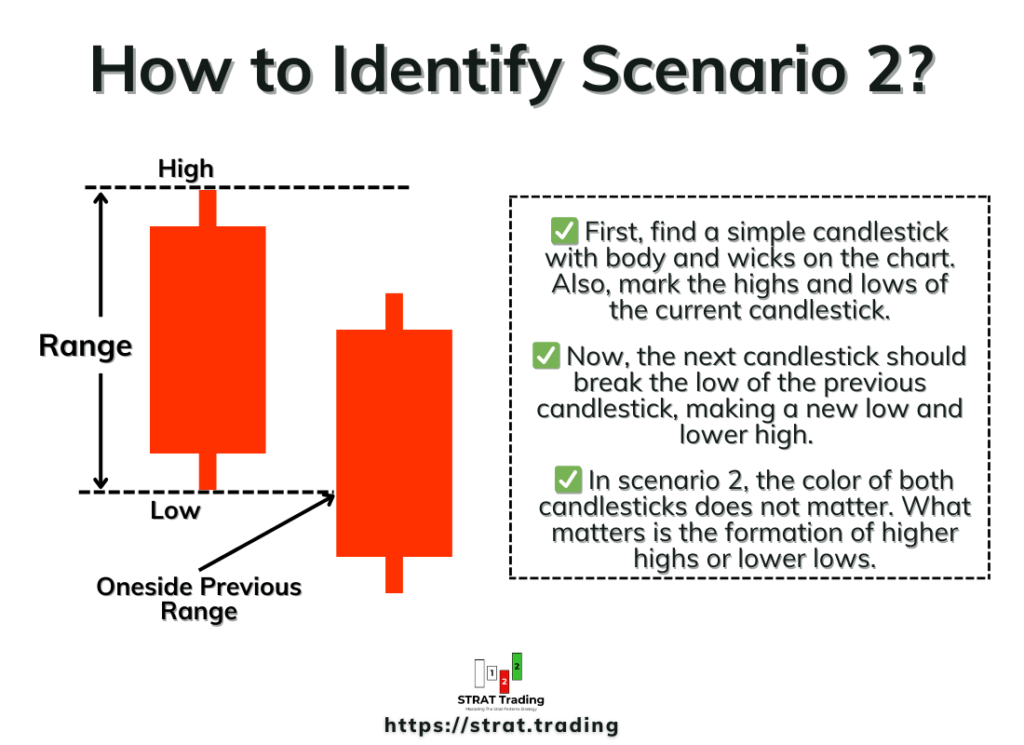
- First, find a simple candlestick with body and wicks on the chart. Also, mark the highs and lows of the current candlestick.
- Now, the next candlestick should break the high of the previous candlestick, making a new high and higher low.
- In scenario 2, the color of both candlesticks does not matter. What matters is the formation of higher highs or lower lows.
Keep in mind that the current candlestick should not break the low of the previous candlestick. However, it should make an HH and HL price pattern.
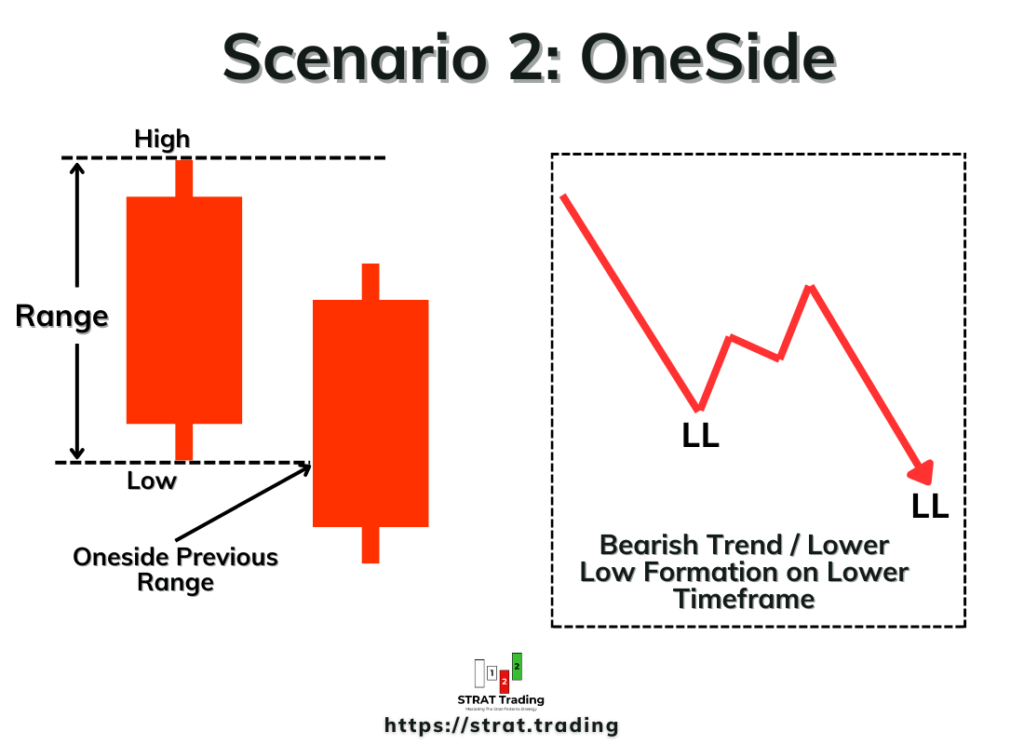
In the case of bearish candlesticks, the price should make a Lower low (LL) and lower high (LH) pattern on the chart. This is also scenario 2. In this case, the current candlestick must not break the high of the previous candlestick.
Lower timeframe analysis
If we dive deeper into scenario 2 by switching to lower timeframes, we will find that these two candlesticks are just representations of a trending market.
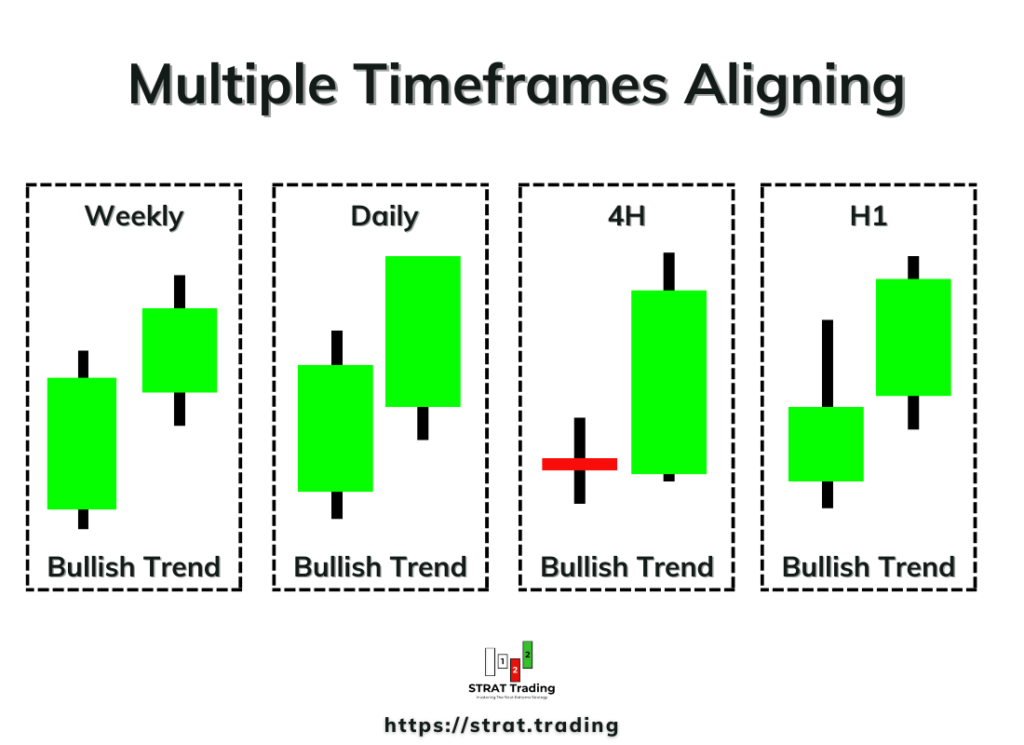
For example, when two bullish candlesticks or scenario 2 form on a higher timeframe, like daily, then on a lower timeframe, we will see two bullish price waves making a higher high and higher low.
This means that scenario 2 tells us about the direction of market makers. Because market makers build trends in the market, a retail trader can also make a profit only if he follows them.
What is the purpose of scenario 2 in the strat?
In the strat patterns, we use three scenarios to determine the market conditions and make decisions accordingly.
We can use the scenario 2 mainly for two purposes:
- A higher timeframe analysis is needed to determine the market direction.
- To determine the take profit level or keep on holding the trade to maximize the profit potential.
In the strat strategy, we always align the trend on higher timeframes, like weekly, daily, 4h, and 1h, so that we can trade in that direction. So, if we found the bullish scenario 2 on the higher timeframes, then it means that we will have to trade in the bullish direction.
On the other hand, if we find bearish scenario 2 on higher timeframes, then we will have to trade in the bearish direction only.
Scenario 2 also helps to hold a running trade. For example, if you are holding a bullish trade and you find a bullish scenario 2 formation on the current timeframe, you’ll have to keep on holding the trade until any other reversal scenario forms on the chart.
These two are the primary purposes of learning scenario 2 in the strat patterns trading.
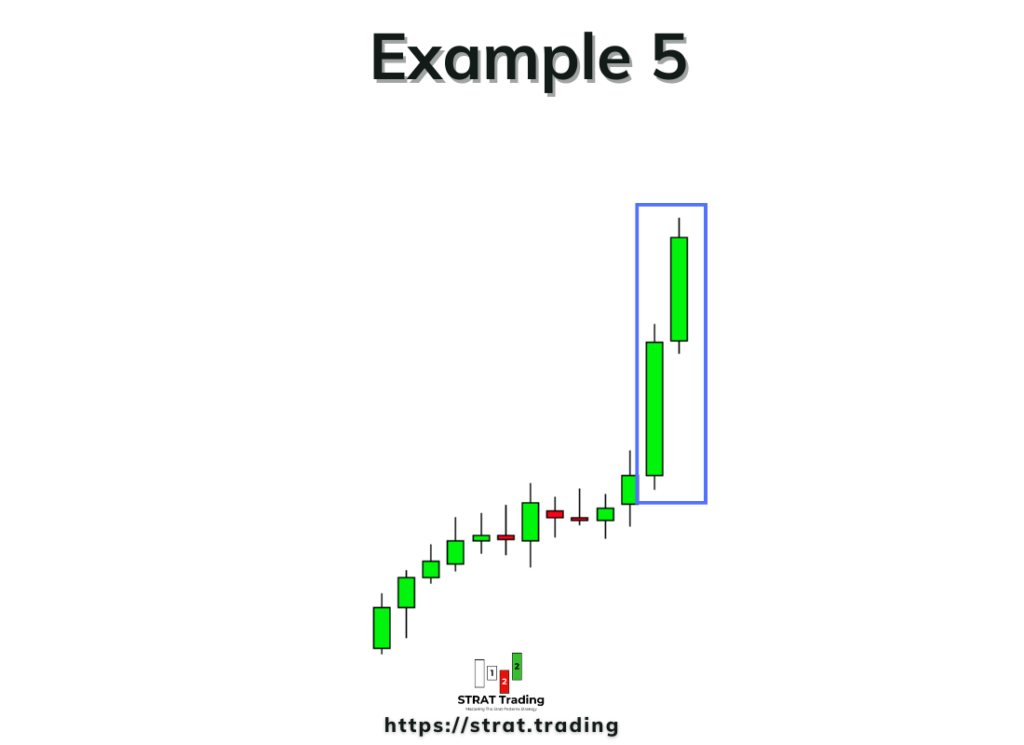
Examples
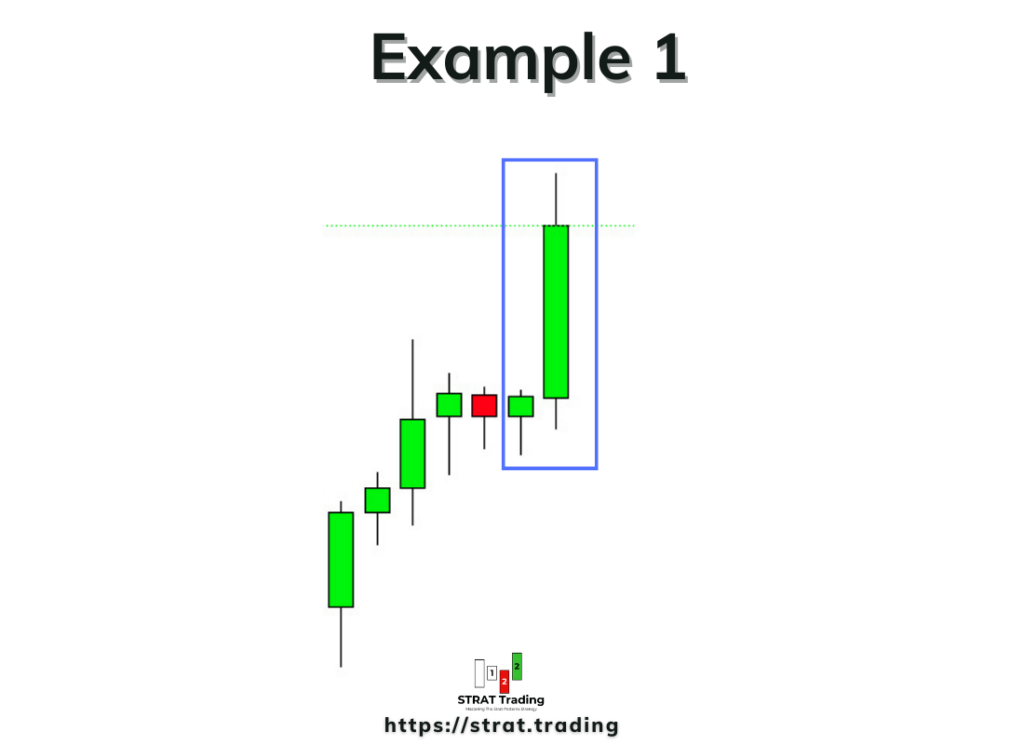
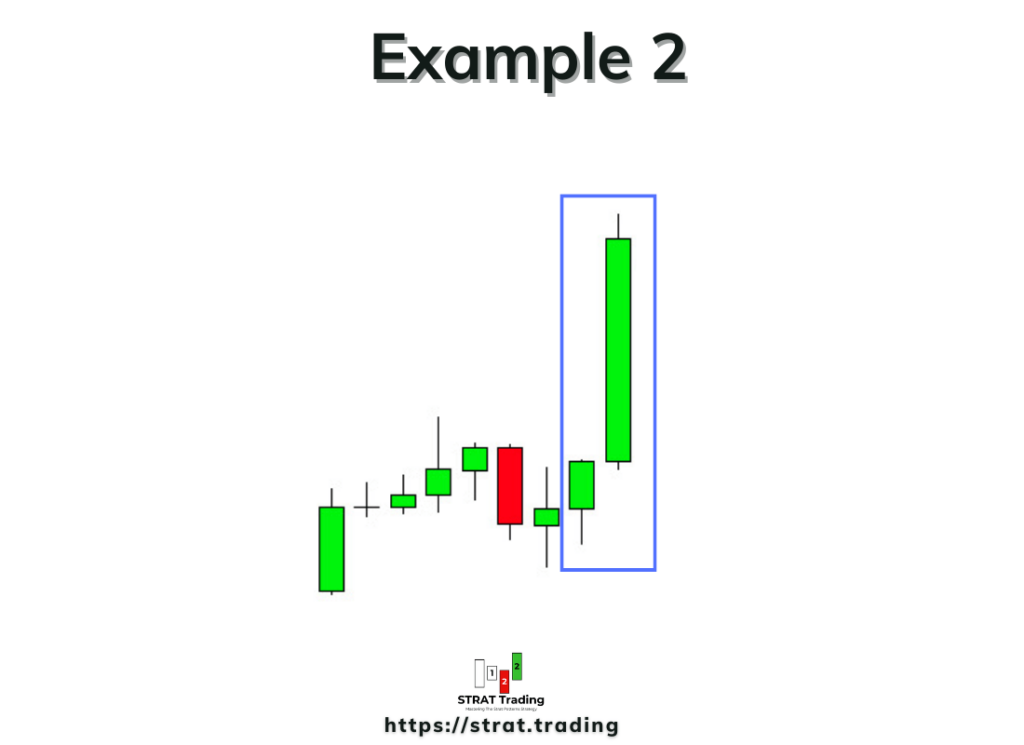
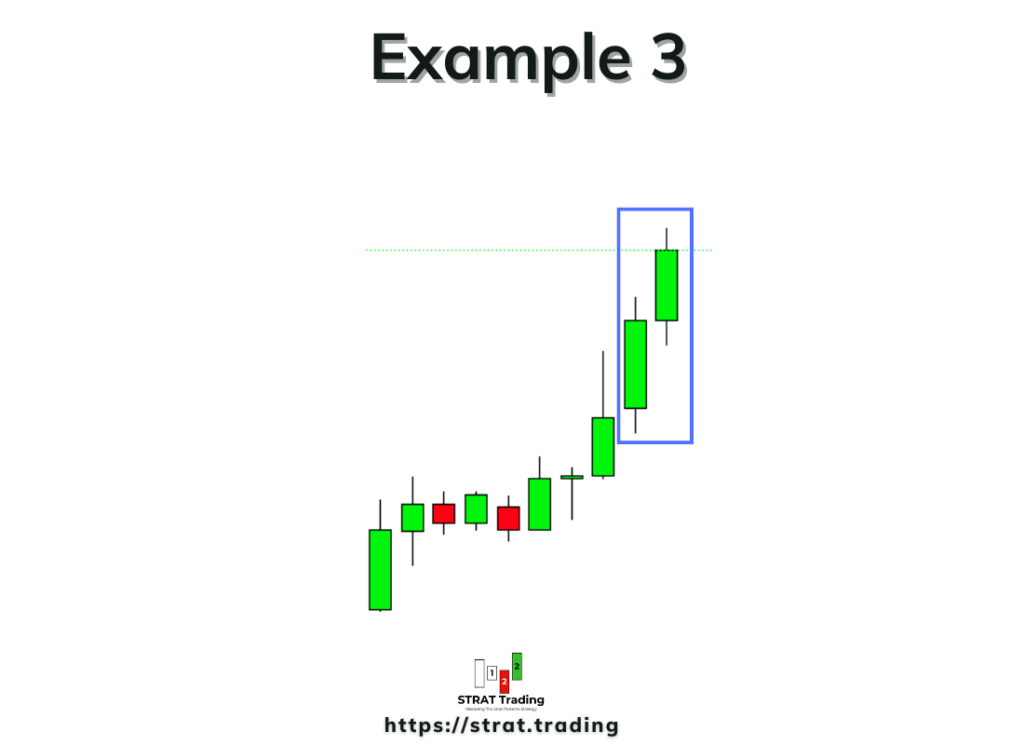
Below are five examples of scenario 2. When the two most recent candlesticks make a higher high and higher low or a lower low and lower high, it means scenario 2 has been formed simply.
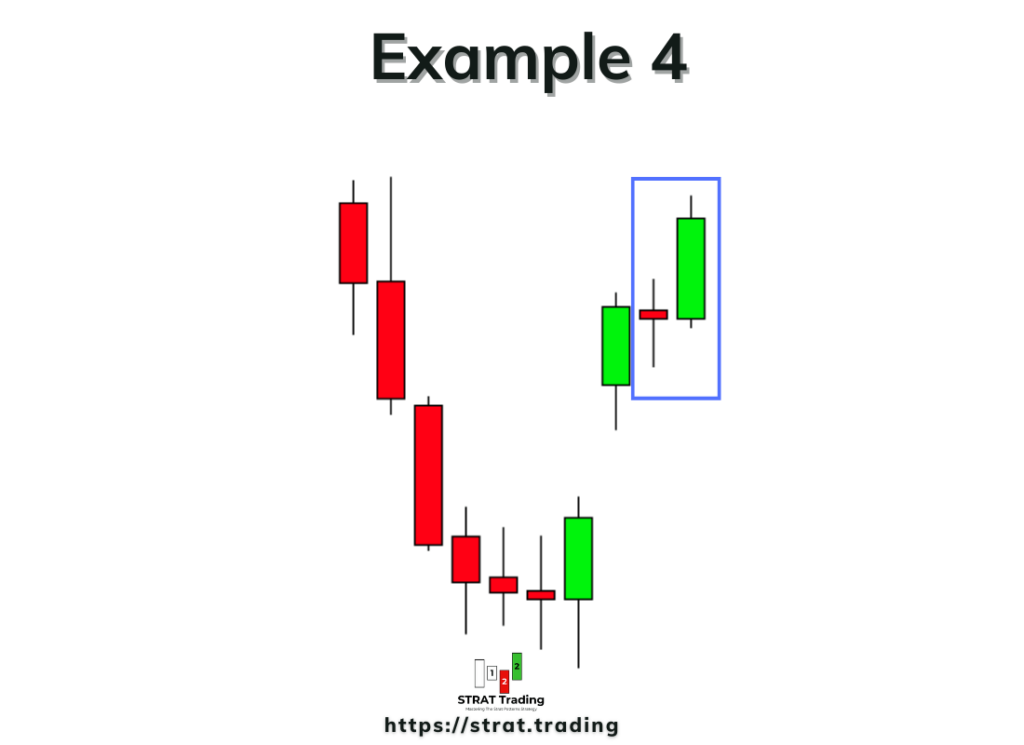
Also, check example 4. Both candlesticks have different colors, but they are still making high highs and high lows, which means scenario 2 is valid here.
The bottom line
Scenario 2 helps find the trend alignment on different higher timeframes, which in turn will give you a high-probability trade setup.
I highly recommend that you learn all three scenarios before learning the strat patterns strategy because these scenarios are the building blocks of the strat strategy. You must learn three scenarios accurately. That’s why I suggest spending as much time as possible learning these scenarios.
Now, it’s your turn to backtest on the TradingView using the reply feature. You can also take screenshots to analyze them later.
If you have any questions, remember to ask me in the comments below. It will also help others to learn in detail.