Definition
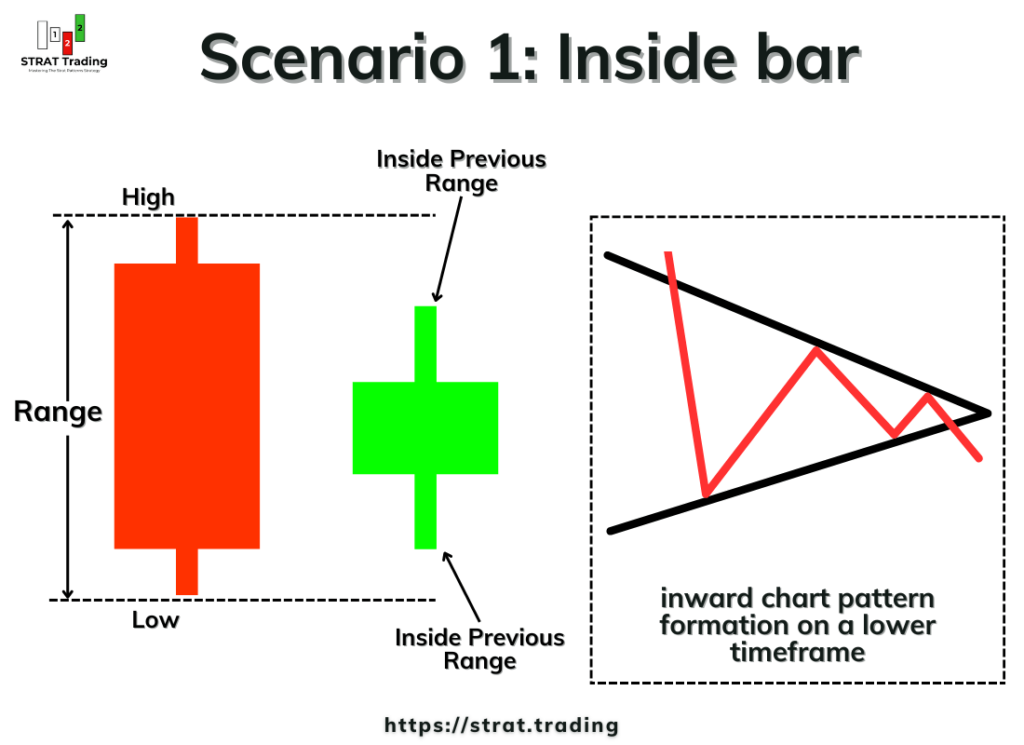
When neither side of the previous candlestick is taken out by the current candlestick then it makes scenario 1 on the candlestick chart. It is also known as the inside bar.
There are three major scenarios that are the building blocks of the market in the strat patterns. Inside bar is scenario 1 in strat trading, and in this lesson, I will explain scenario 1 in detail and also attach images of the best inside bars in the market so that you will be able to identify the accurate scenario 1 pattern in the strat strategy.
How do we identify scenario 1?
Scenario 1 in strat trading is simply a representation of an inside bar candlestick pattern. However, you will still have to remember a few things that I have explained below.
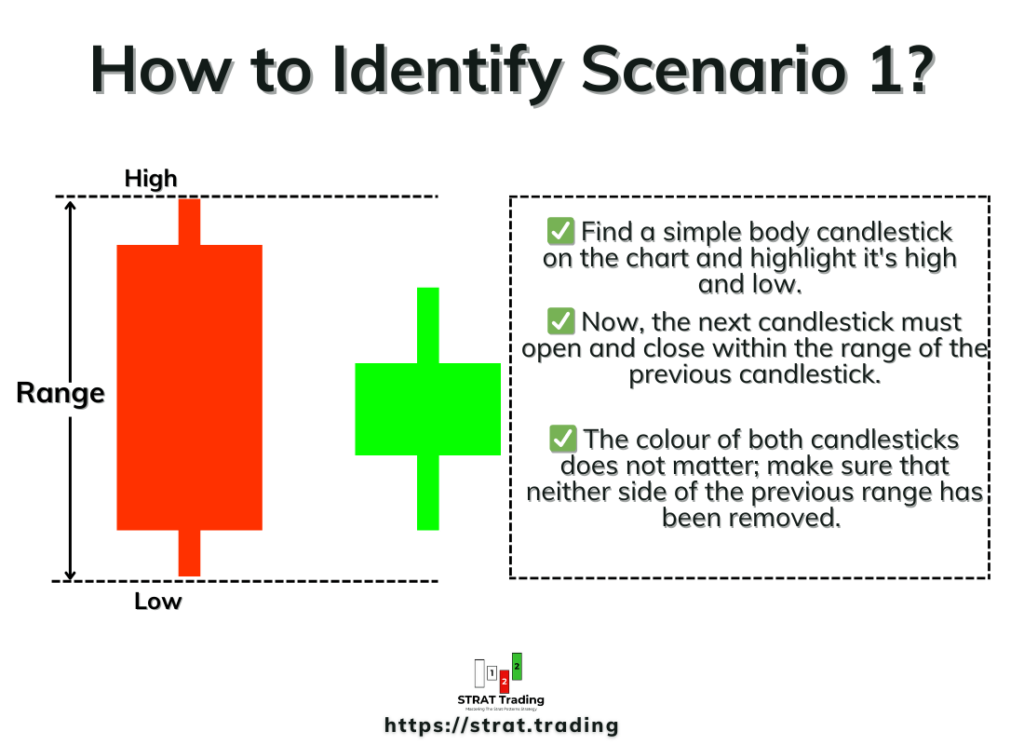
To identify the scenario one on the candlestick chart, you’ll have to follow the following set of rules properly:
- Find a simple body candlestick on the chart and highlight it’s high and low. Compared to previous candlesticks, it must not be very big or high-wave.
- Now, the next candlestick must open and close within the range of the previous candlestick. It should not break above or below the previous candlestick.
- The colour of both candlesticks does not matter; make sure that neither side of the previous range has been removed.
If you switch to a lower timeframe, you will see an inside range formation. Each successive wave will be smaller than the previous wave. This also represents the inside bar formation.
Remember that if a massive mother candlestick forms on the chart, you should skip that because market makers will trap you in broadening and inside formations instead of just trend reversal after the breakout.
Importance of Scenario 1
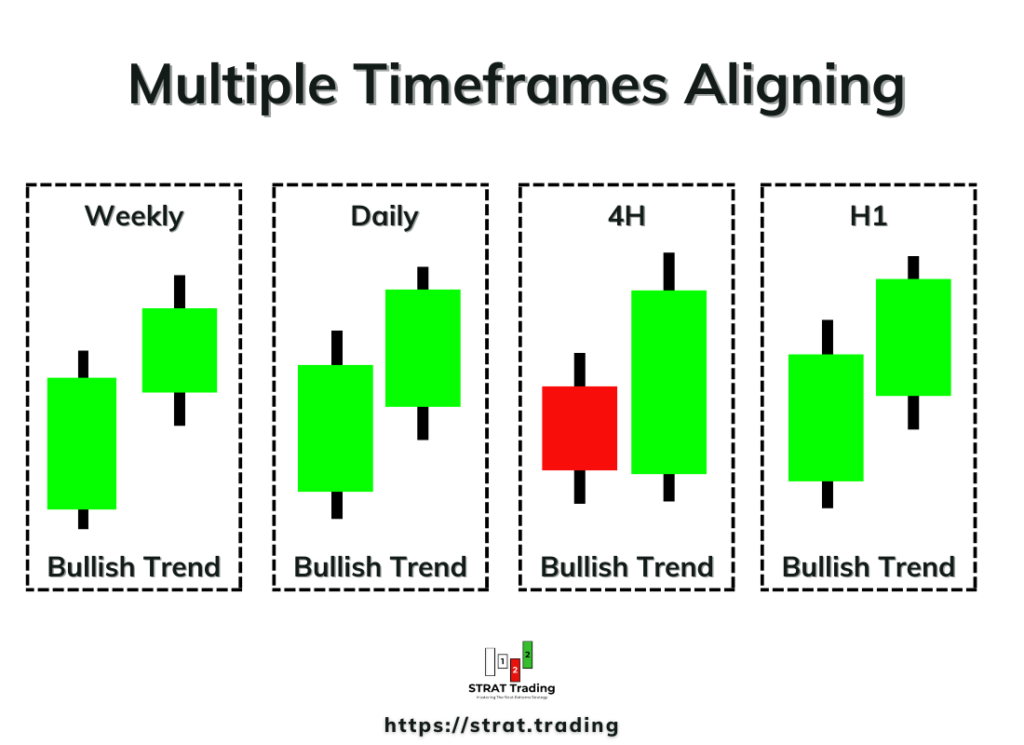
In the strat trading, we analyse multiple timeframes to align the timeframes in one direction only.
For example, if the weekly, daily, H4, and H1 timeframes all show a bullish trend, then we can trade in that direction based on the strat patterns on the H1 timeframe.
However, if there is a scenario 1 formation on the daily timeframe only, then it means the market is in an indecision phase on the daily chart. Then, we will skip that trade on H1 because the trend is not aligning on all timeframes, and the market is in an indecision phase. Market makers are still deciding their future market direction.
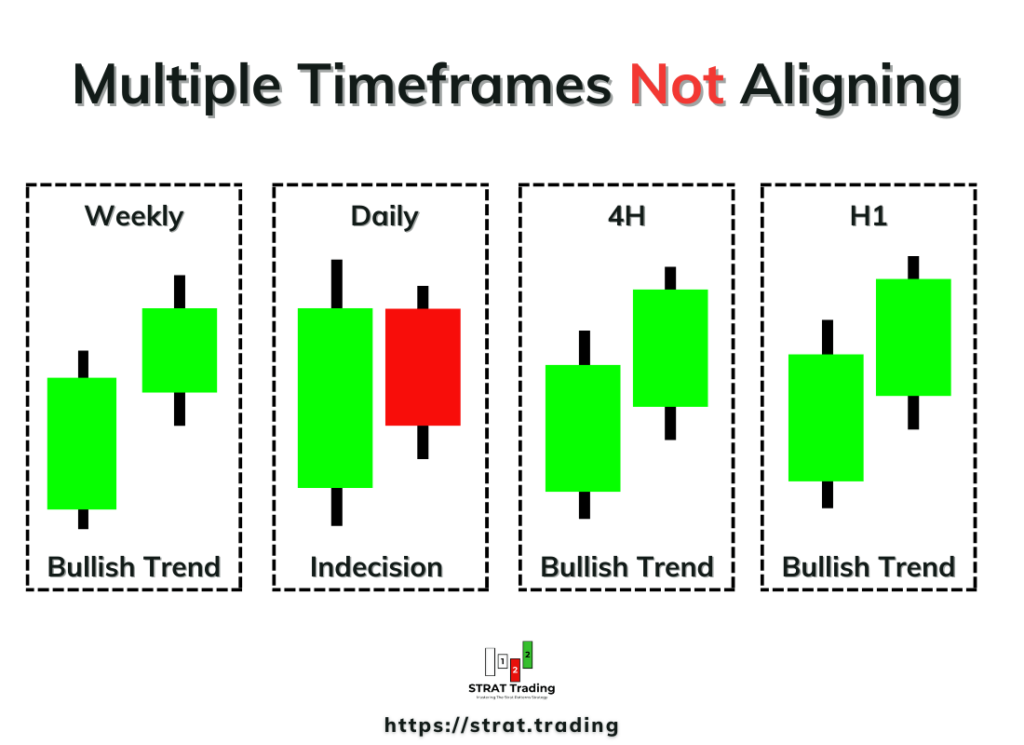
So, in this situation, scenario 1 helps filter the trend.
There are also many other cases where we will use scenario 1 to enter or close a trade.
Scenario 1 is the starting point of a trend. It represents either a trend that will continue after the inside bar breakout or a trend that will reverse. The confirmation only comes after the inside bar breakout.
That’s why scenario 1, or the inside bar, is the most essential pattern in the strat patterns. Also, the inside bar pattern looks very simple. However, you should still spend time on the chart to learn the market behaviour in different situations that will improve your decision-making power in trading.
Examples
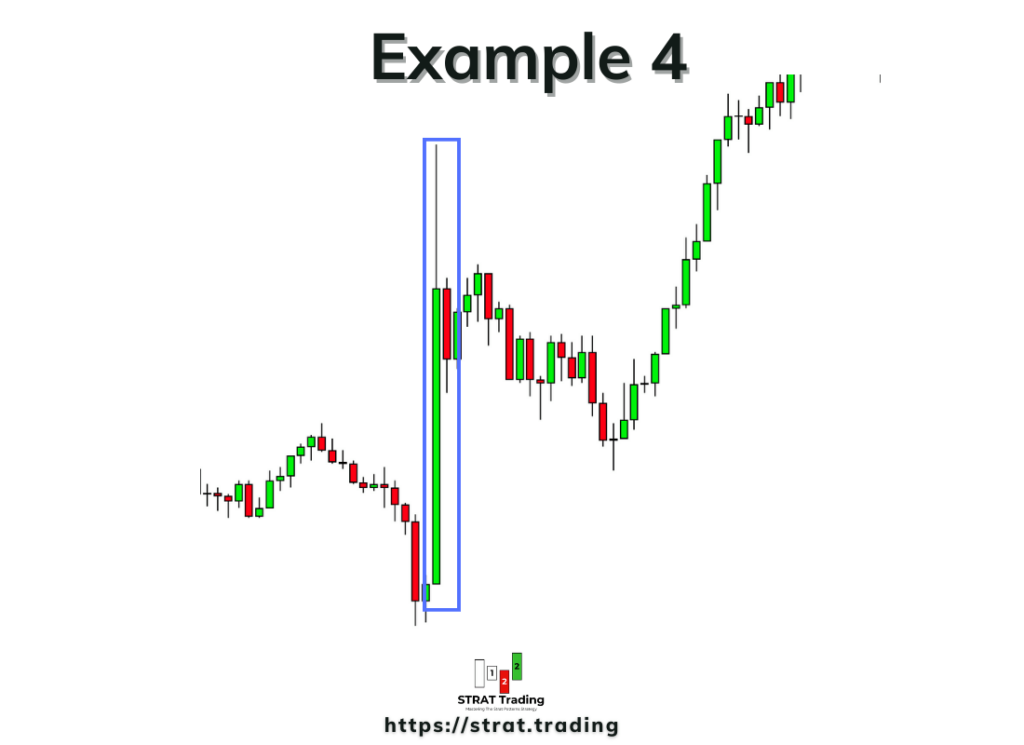
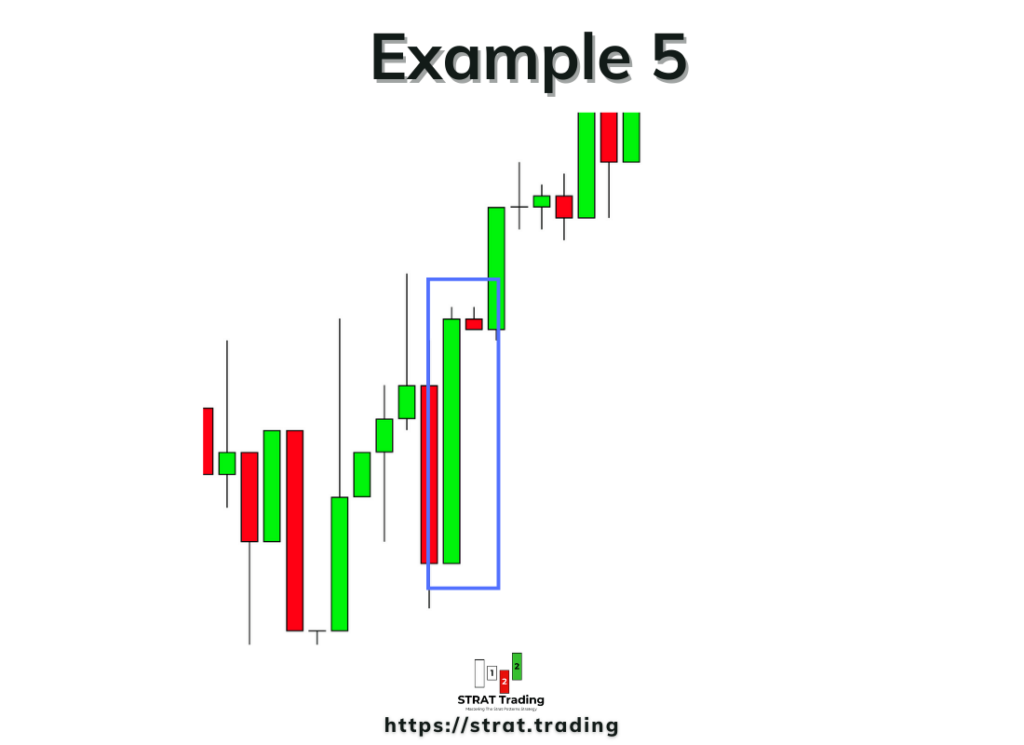
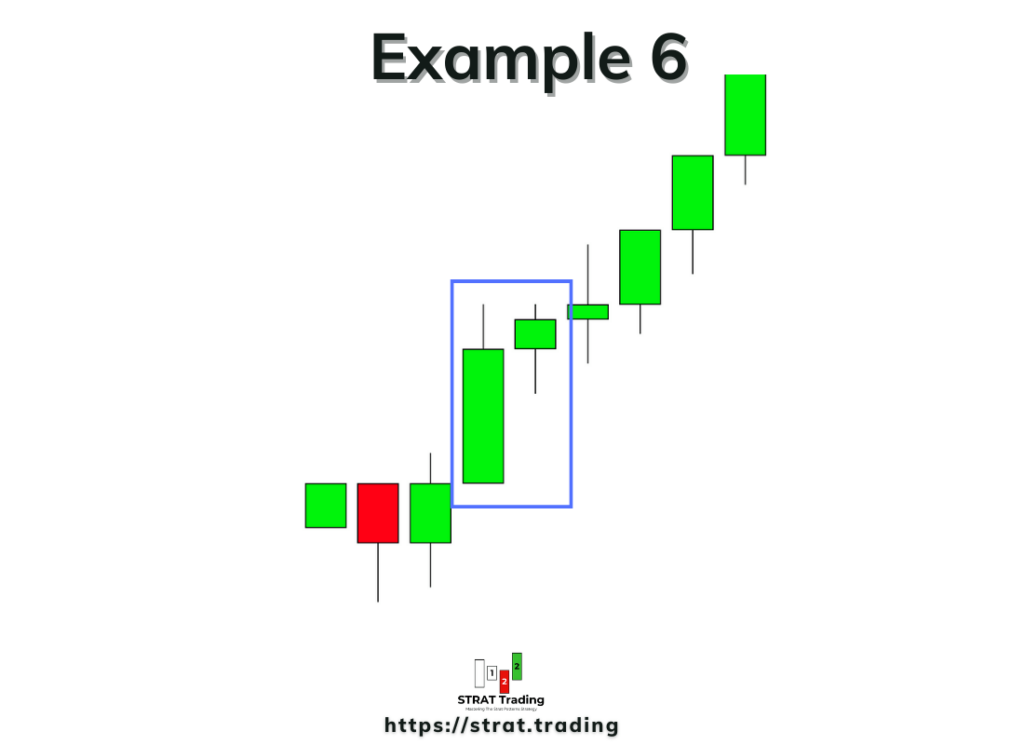
Here are a few examples of scenario 1. The breakout of the inside bar confirms the future direction of market makers.
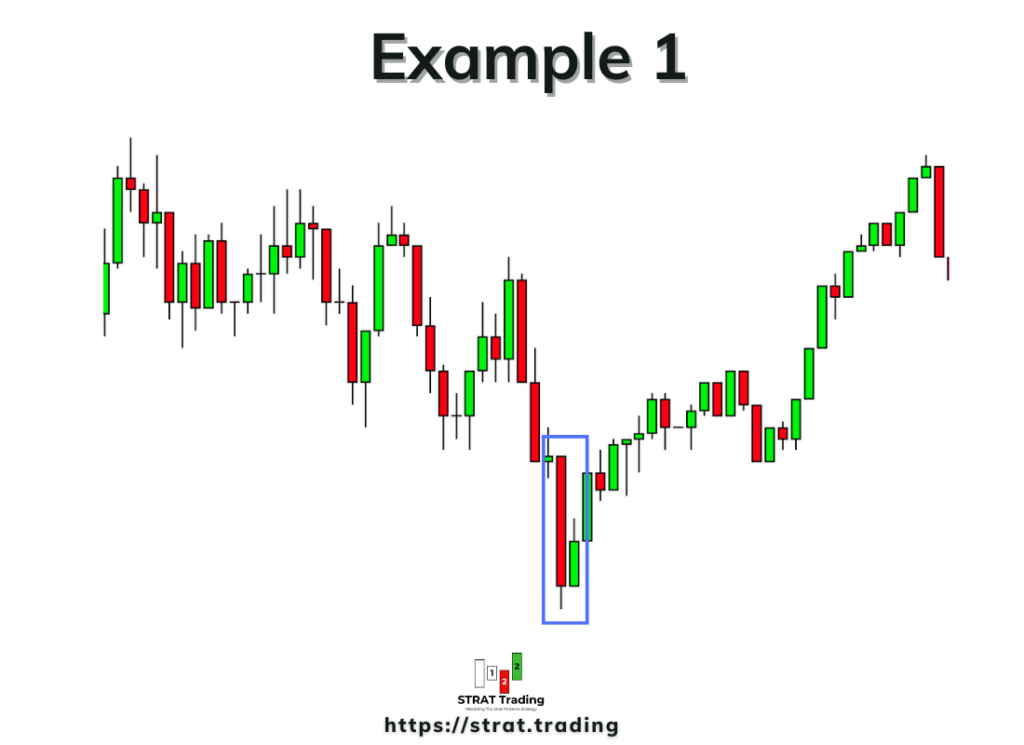
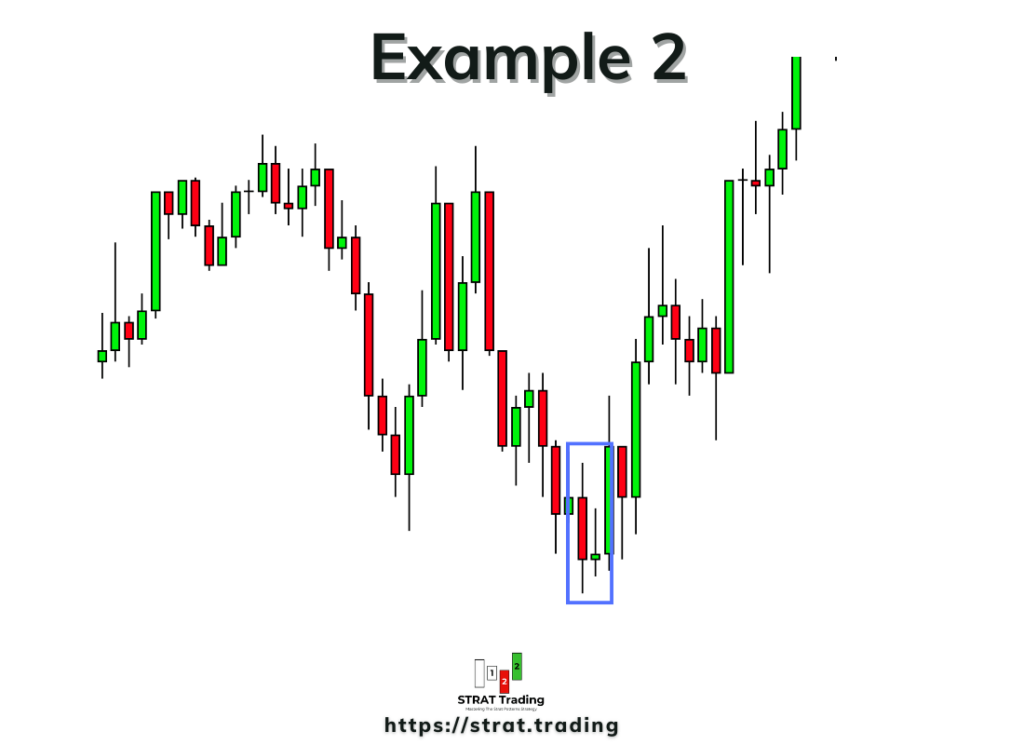
When the scenario 1 pattern forms in the oversold region or support zone, the chances of a trend reversal from a bearish to a bullish trend are also high. Example 1 and example 2.
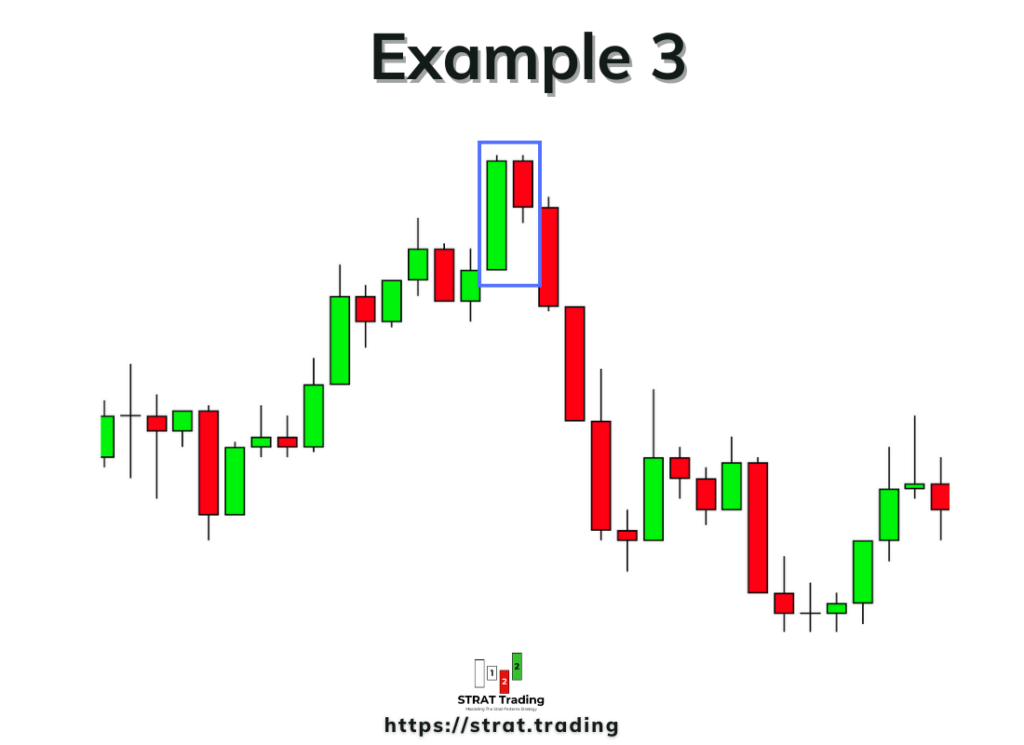
Also, note that when scenario 1 forms at the overbought region or at the resistance zone, then the chances of a trend reversal from bullish to bearish are high.
Also, avoid using very big candlesticks in scenario 1 and such types of trade setups. Look at the image Example 4 and Example 5.
It also shows the trend continuation when it forms mainly within an impulsive wave or in the direction of the trend.
The bottom line
In conclusion, scenario 1 shows the indecision phase. You will have to stop and let the market makers decide the direction and then open the trade in that direction. If scenario 1 is forming during timeframe alignment, don’t open the trade.
If you want to master the strat patterns strategy, you must learn these scenarios properly because these three are universal principles in trading. And these principles always work. This set of rules will help you make better decisions in actual trading.
Now it’s your turn. You’ll have to take at least 30 screenshots of an inside bar pattern in different market conditions and analyse them one by one to extract results.
If you have any questions or find anything difficult in identifying scenario 1, don’t forget to comment below.