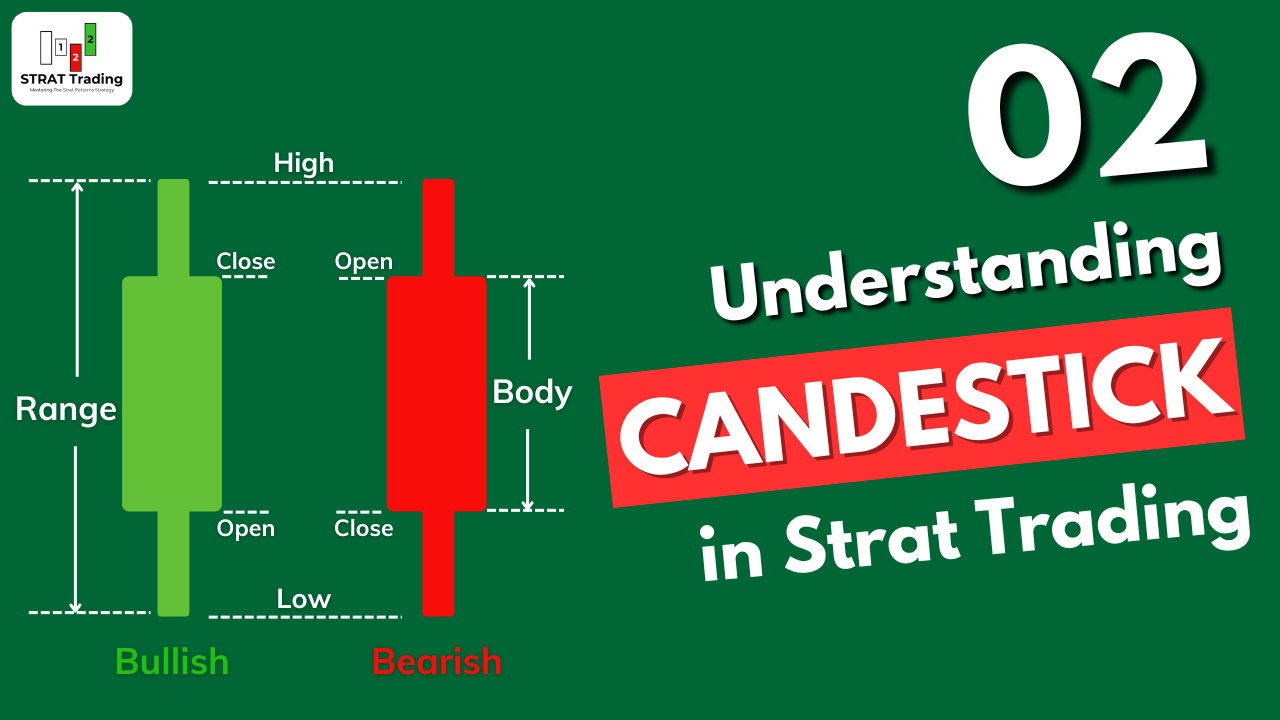
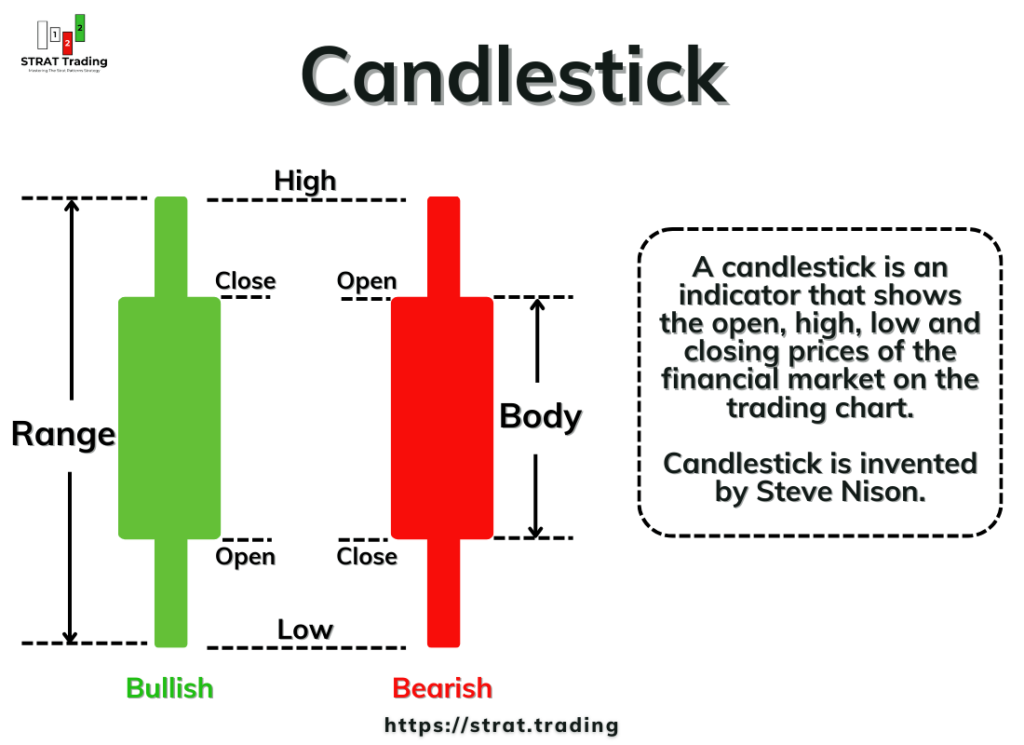
A candlestick is an indicator that shows the open, high, low and closing prices of the financial market on the trading chart. Candlestick is invented by Steve Nison.
Think of candlestick analysis as a visual representation of the market’s heartbeat on your trading chart. It allows you to easily pinpoint the closing price of a specific stock or financial asset on any timeframe, be it daily, weekly, monthly, or beyond. These OHLC (open, high, low, close) values are the lifeblood of technical analysis, providing invaluable insights for forecasting purposes.
Components of a Candlestick
There are two primary components of a Candlestick:
- Body
- Shadow/Wick
Body
The price range between the opening and closing price of a specific time frame is called the body of the candlestick. It represents the sentiments of buyers and sellers. For instance, if the body is large, it indicates a significant price movement, suggesting strong buyer or seller sentiment. On the other hand, a small body suggests a lack of conviction in the market. A trader can find the strength of buyers or sellers by measuring the size of the body.
The body of the candlestick is further categorized into two types based on color:
Bullish candlestick (green color body): If the closing price of a Candlestick is higher than the opening price, then it is called a bullish candlestick. It means there are more buyers than sellers and prices will move up. This is a positive sign for those who are considering buying the stock.
Bearish candlestick (red color body): If the closing price is below the opening price of the candlestick, then it is called a bearish candlestick. It represents more sellers in the market than buyers so that the price will decrease, and bears will be stronger.
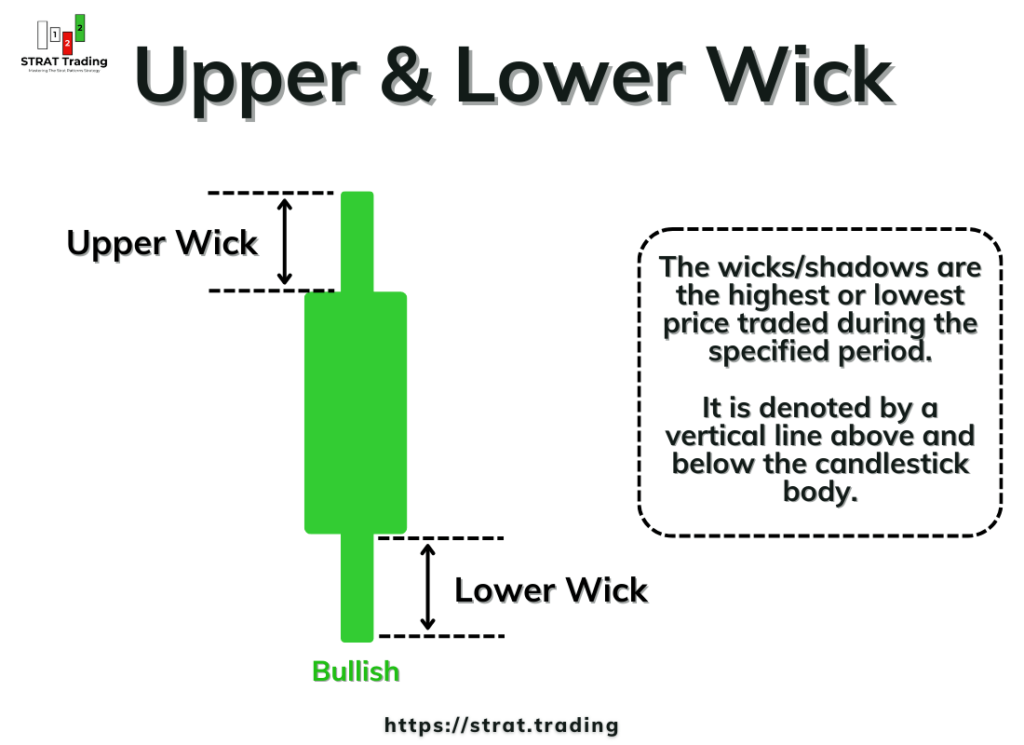
Wick/Shadow
The wicks/shadows are the highest or lowest price traded during the specified period. It is denoted by a vertical line above and below the candlestick body.
The shadows are further categorized into two types based on the location.
Upper wick: It forms at the top of the candlesticks’ body and extends to the highest price traded during the period. The upper wick shows the maximum price level achieved before the price was pushed down the opening/closing price.
Lower wick: It forms below the bottom of the candlestick’s body and extends to the lowest price traded during the period. The lower wick represents the lowest price level achieved by the price before the closing/opening price was pushed up.
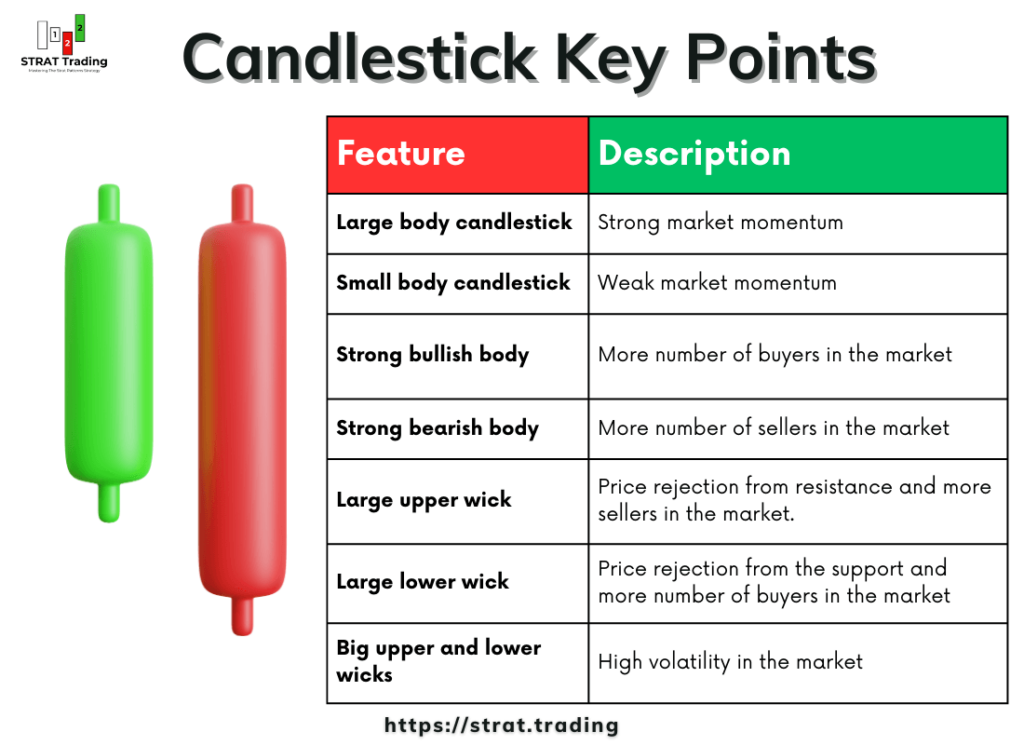
👉 Key Points to remember
- Large body candlestick = Strong market momentum
- Small body candlestick = Weak market momentum
- Strong bullish body = More number of buyers in the market
- Strong bearish body = More number of sellers in the market
- Large upper wick = Price rejection from resistance and more sellers in the market.
- Large lower wick = Price rejection from the support and more number of buyers in the market
- Big upper and lower wicks = High volatility in the market
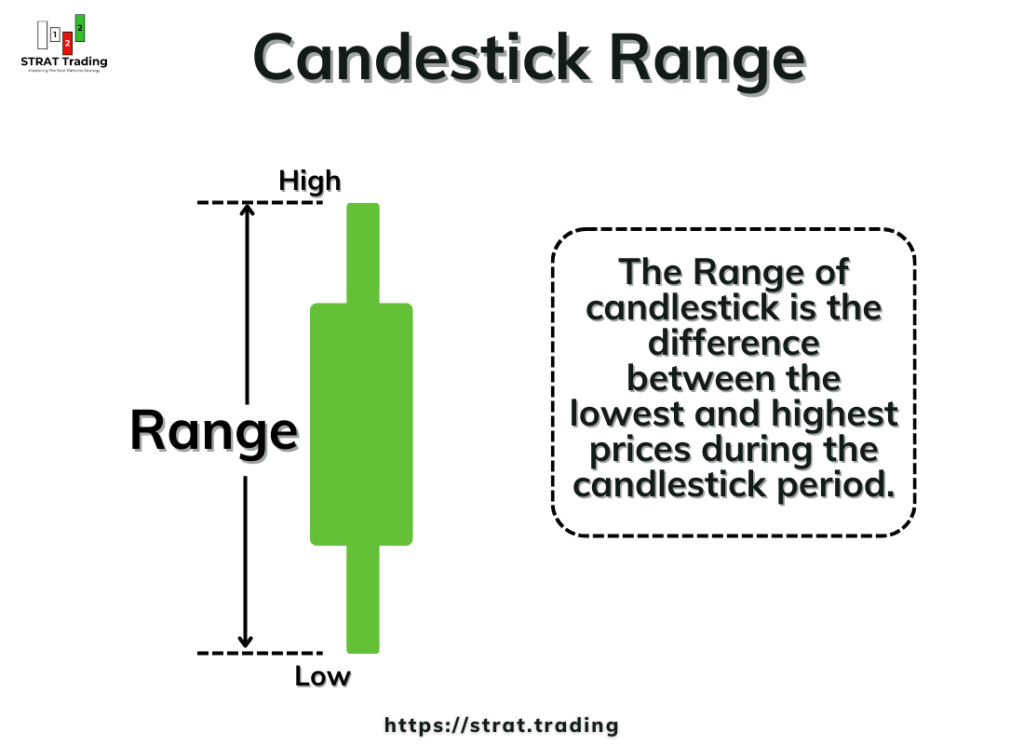
What is the Range of candlestick?
The Range of candlesticks is the difference between the lowest and highest prices during the candlestick period.
Understanding the Range is important in strat trading because we will use this term extensively in the upcoming lessons.
There are two components of the Range of candlestick:
- High: It is the highest price level reached during the traded period.
- Low: It is the lowest price level achieved by price during the traded period.
Why is Range important in strat trading?
In strat trading, we use the three market scenarios to find the current and future conditions of the market. This cannot be done without finding the Range of the candlestick. That’s why we first find the Range and then forecast based on the three scenarios.
Let me explain in more depth to make it easy for you.
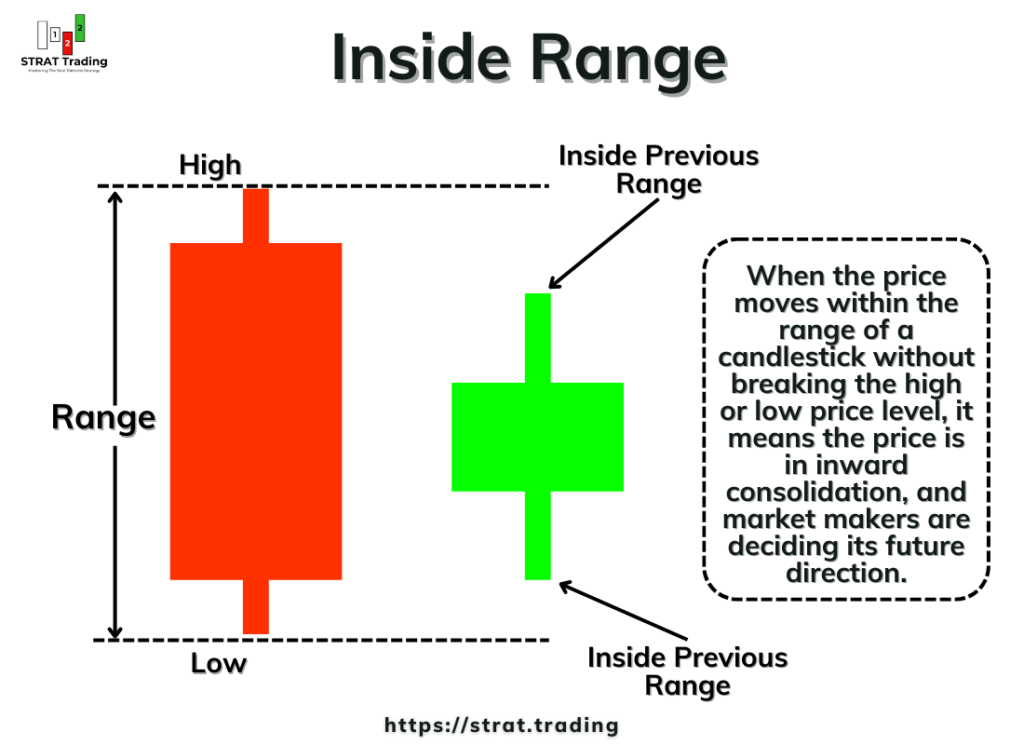
Inside Range
When the price moves within the range of a candlestick without breaking the high or low price level, it means the price is in inward consolidation, and market makers are deciding its future direction.
See the image below. I have marked the upper and lower levels, showing the range of candlesticks. But for the next 4 to 5 candlesticks, it remains within this Range, giving many clues about the market conditions.
Range break or Oneside Range
The range breakout represents the price crossing the previous price range levels in a bullish or bearish direction. For example, if the price crosses the upper Range, then it means a higher high has been formed, and now a bullish trend will start.
On the other hand, if the price crosses the lower range or goes below the lower range level, then a lower low has been formed, and a bearish trend will start.
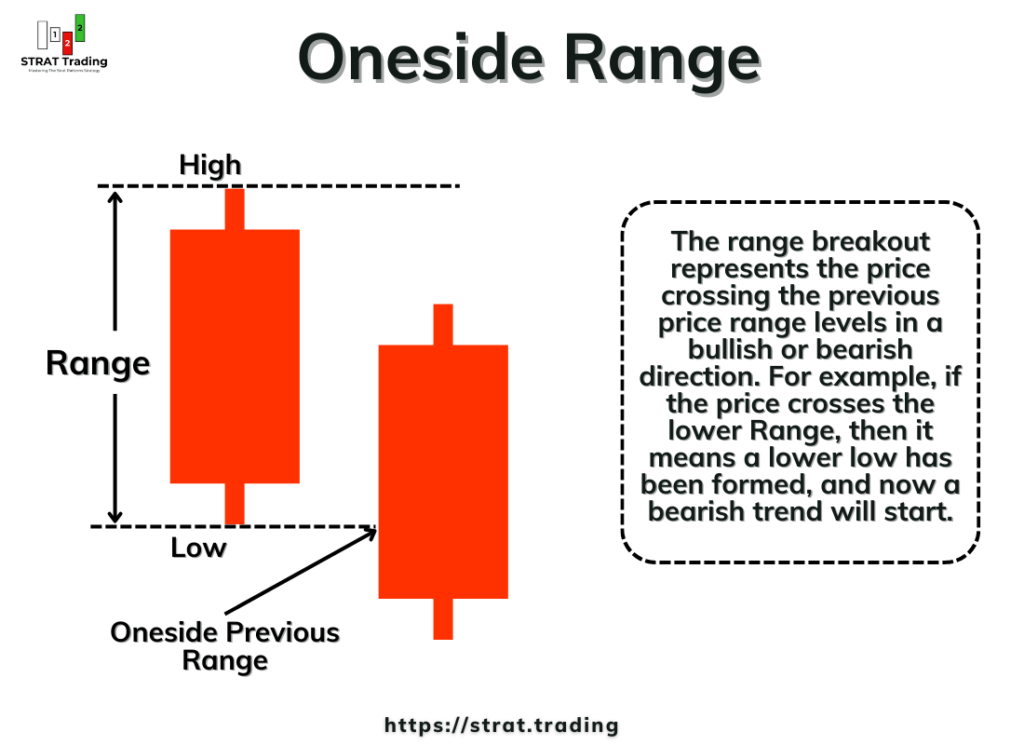
As you can see, the range of candlesticks provides much information regarding the trend direction.
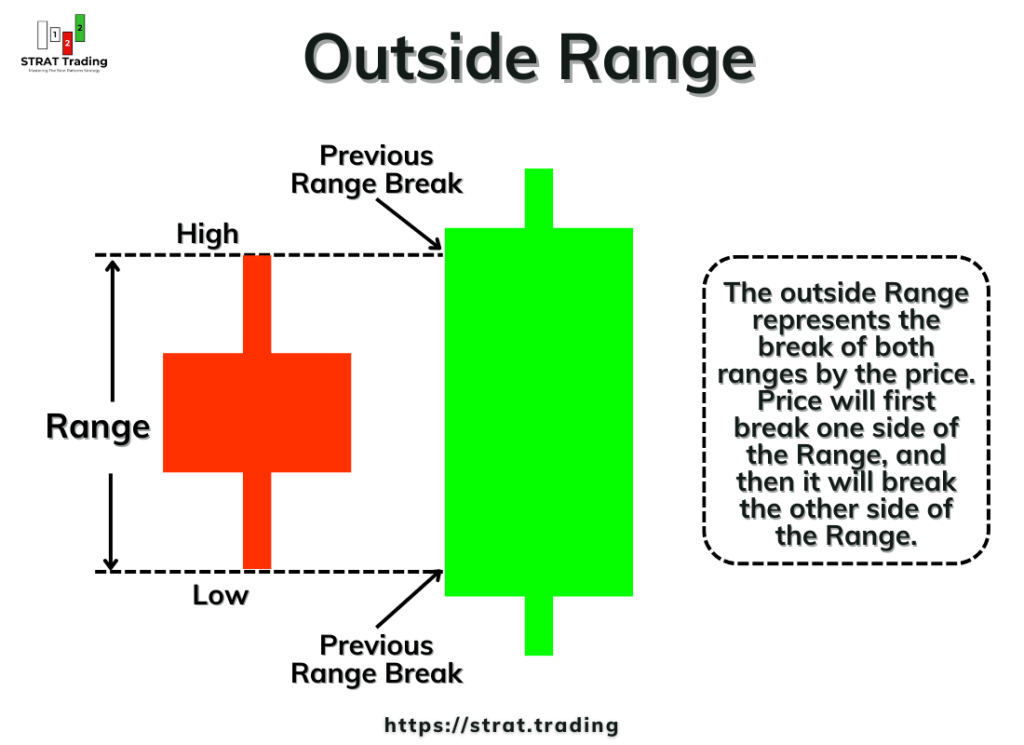
Outside Range
The outside Range represents the break of both ranges by the price. Price will first break one side of the Range, and then it will break the other side of the Range. This represents that there is high volatility in the market and a big shift in market trend is about to happen.
Now you will be able to understand the importance of the Range of candlesticks in Strat Trading.
Timeframe in candlestick analysis
In strat trading, we will also learn about timeframe continuity, in which we align the trend on different timeframes to get a high-probability trading signal. That’s why it’s important to understand the timeframes of candlesticks.
On the candlestick chart, each candlestick shows the price movement over a specified time interval. For instance, if you choose a 30-minute timeframe, each candlestick will form after 30 minutes and show traders’ activity during that time. However, if you choose a daily timeframe, each candlestick will represent the trading activity of the whole day. So, the timeframe you choose determines the level of detail you see in the market.
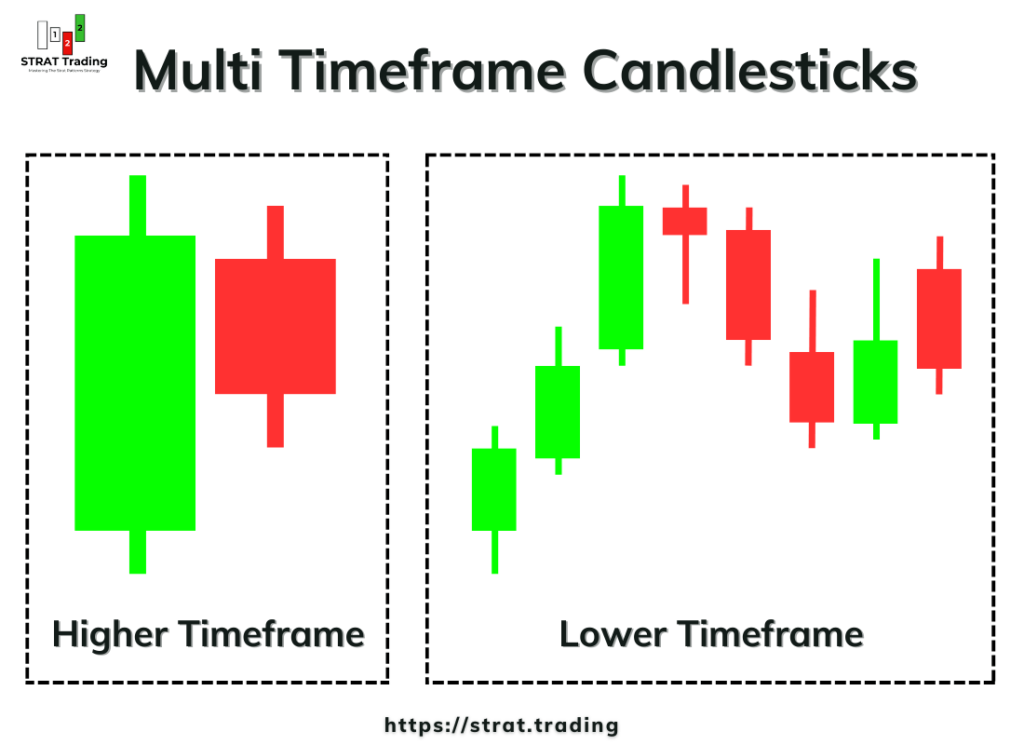
For example, one daily candlestick will contain 24 hourly candlesticks. So, a shorter timeframe provides a more detailed view of the market.
In strat trading, we do the multiple timeframe analysis to get a closer look of the market because from a single timeframe you cannot get an overall view of market. For example, if there is a green bullish candlestick on the daily timeframe, it could indicate a potential buying opportunity. However, if there is an inside consolidation pattern forming on the hourly timeframe, it might suggest a temporary pause in the trend. So, instead of buying solely based on the daily timeframe candlestick, a trader should look at multiple timeframes and then decide if the trend of all timeframes aligns.
So if there is a bullish trend on a daily basis but consolidation in a lower timeframe, then we shouldn’t open a buy trade; instead, we should wait until the price breaks the inward consolidation in a bullish direction and the trend of both the higher and lower timeframes aligns.
The bottom line
Knowing traders’ activity during the formation of a candlestick is very important for a trader. So, a candlestick is a simplistic tool that provides us with necessary information about the market, which we can use for forecasting purposes.
I suggest you practice this lesson on the live chart by analyzing the candlesticks on different timeframes. This activity will help you understand the strat trading strategy.
I would love it if you would practice and then ask me questions in the comments below. I will be happy to answer.