Introduction
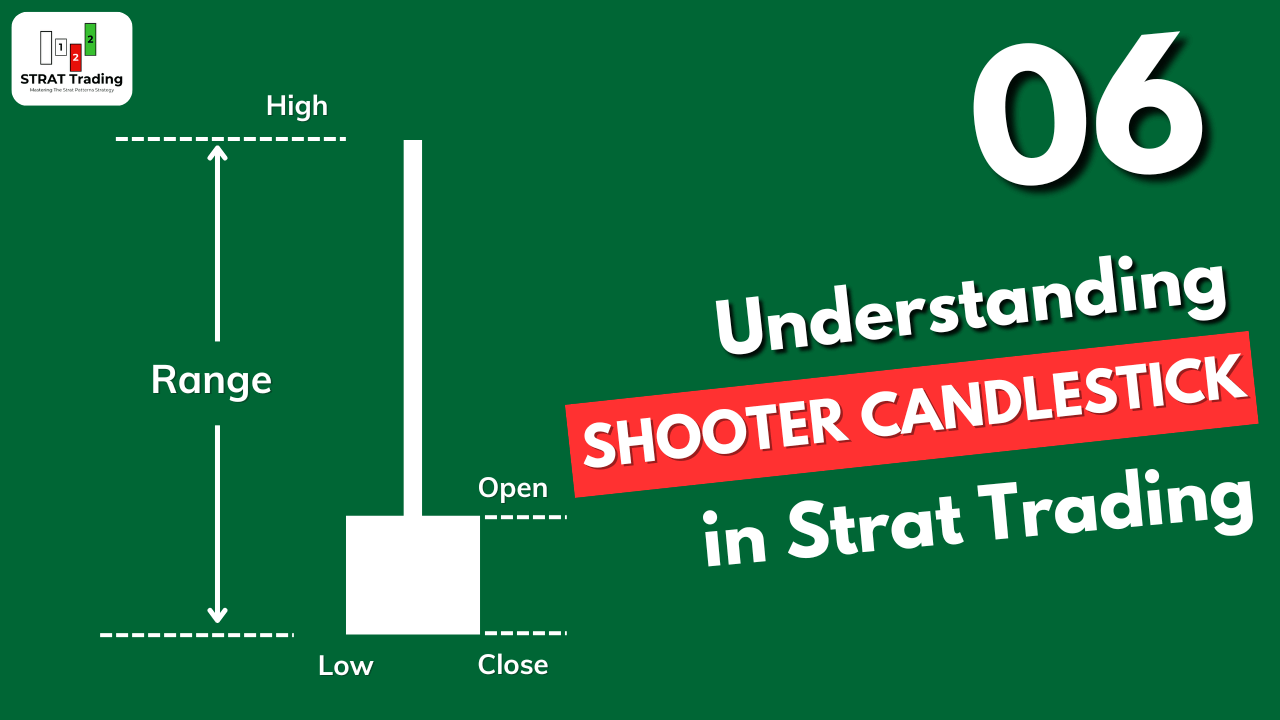
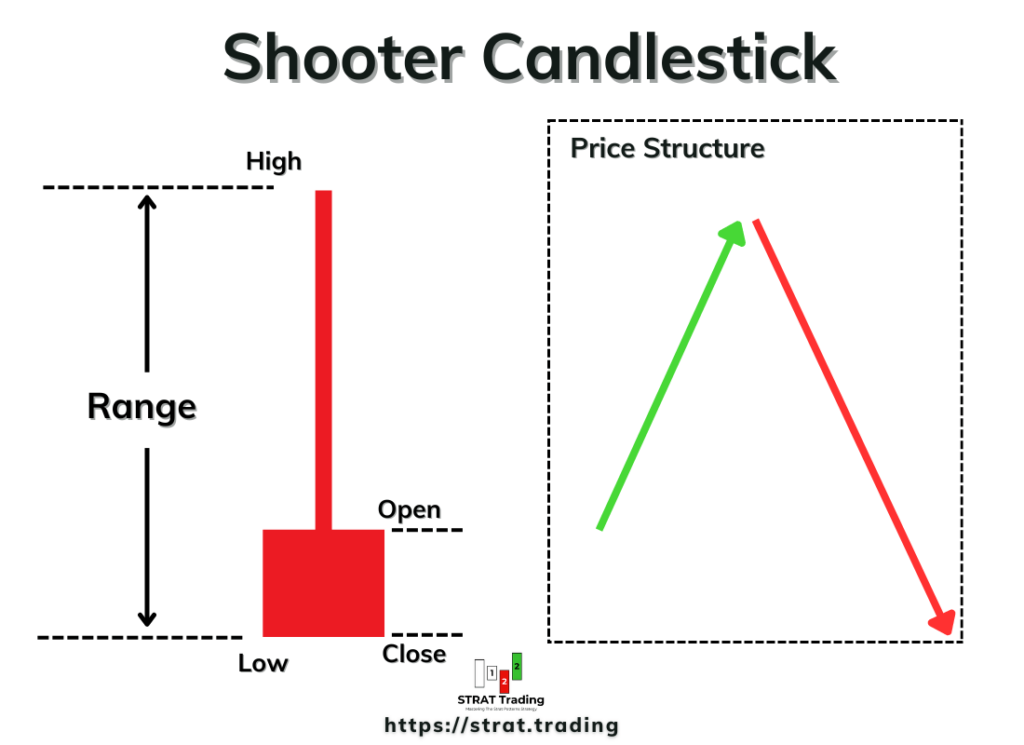
Shooter is a candlestick pattern in which a small body forms at the lower end of the candlestick’s range and a long upper shadow. The upper shadow should be at least three times the length of the body. It is a bearish reversal candlestick pattern that turns the bullish trend into bearish.
In the strat of trading, the shooter candlestick becomes enforced once price breaks the low of the shooter pattern. This means sellers become strong below the low of the shooter pattern. The shooter candlestick is also used as an actionable signal in the strat of pattern trading.
In this article, I will explain how to find the shooter candlestick pattern on a chart and the psychology behind this pattern. I highly recommend digesting this article thoroughly because if your basics are strong, then it will become easy for you to trade with the strat pattern trading method.
How do you find the shooter candlestick pattern accurately?
A shooter candlestick changes the trend from bullish to bearish, and there are a lot of false patterns on the chart. So, to identify an accurate shooter pattern from the crowd, one must follow the following rules:
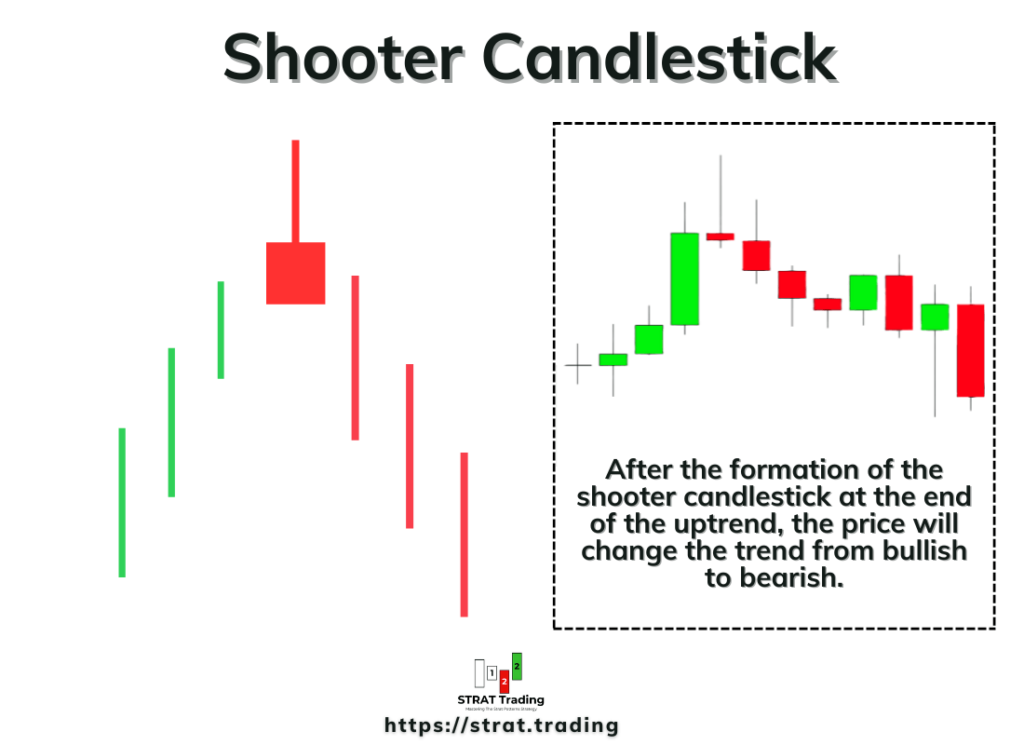
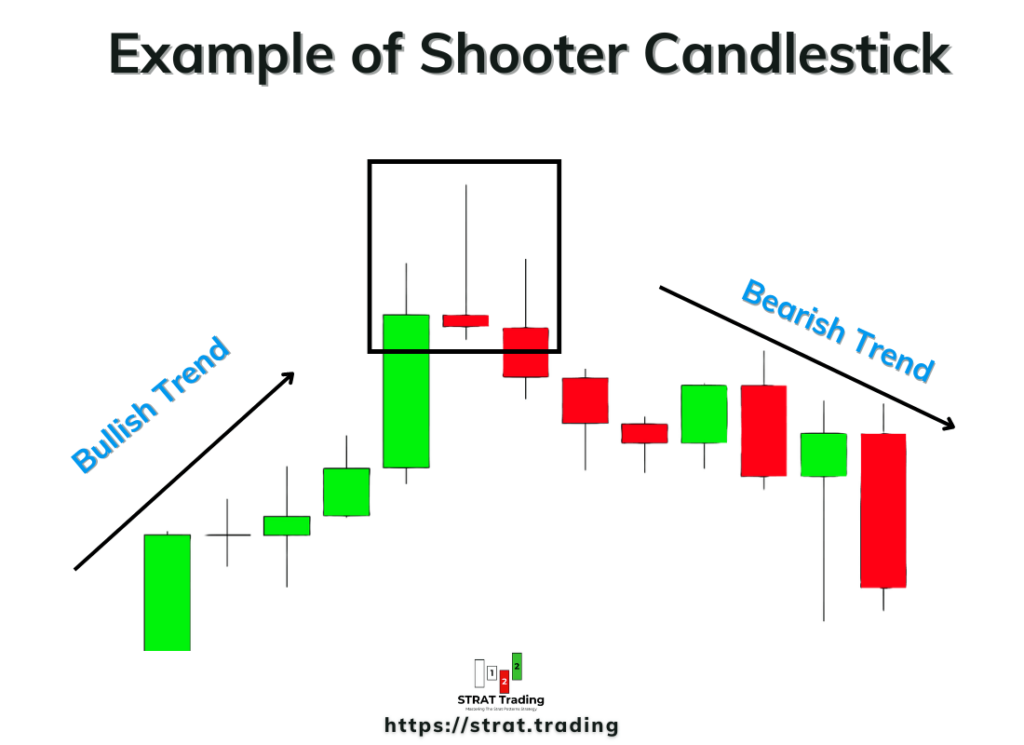
Look for a previous uptrend: Before the shooter’s formation, the trend should be bullish, and the shooter should form at the top of the uptrend. The price will be overbought, and the chances of a trend reversal will be high. The shooter at the top of the uptrend also represents the exhaustion of buyers in the market.
Small body at the bottom: A small body should form at the bottom or in the lower 30% range of the shooter candlestick. The body’s colour can be either green or red, which is unimportant compared to the shooter’s open, close, high, and low.
Long upper shadow: A long shadow/wick forms at the upper end of the body. The shadow should be at least twice the length of the body. The upper shadow shows that buyers tried to keep the trend bullish, but sellers were strong enough to overcome buyers completely.
Little or no lower shadow: A small shadow can also form on the lower side, but it has no value compared with the upper shadow. There’s always a slight difference between the practical state and the ideal state of a candlestick pattern.
After finding these parameters in a candlestick pattern, you are good to do a bearish trade analysis.
The psychology behind the formation of shooter candlestick
Understanding psychology means knowing the activity of traders behind the candlestick chart. When a trader understands what’s happening behind the chart, he will be able to predict the market accurately.
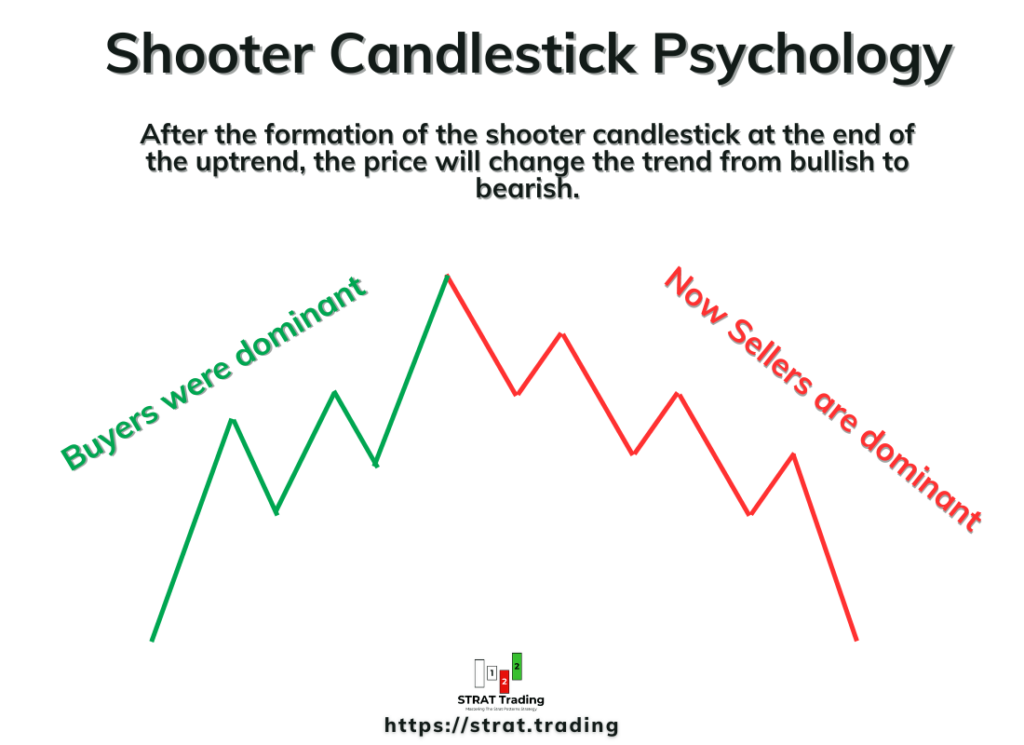
The price continues increasing during the shooter candlestick formation, keeping the trend bullish. At this point, buyers are stronger than sellers. But when the price reaches a key level or resistance level, sellers come into play, and they keep on decreasing the price until it reaches close to the opening price of the candlestick.
This activity of traders shows that buyers tried to keep the trend bullish, but at specific resistance, sellers were strong enough to push the market in a bearish direction. Now, the chances of a trend reversal from bullish to bearish are high, and the trend will most probably change.
Trading is about increasing the probability of a trade setup to stay on the winning side in the long run.
How do you trade the shooter candlestick in the strat trading?
After learning to spot the shooter candlestick, the next step is to trade the shooter in the strat patterns.
We can use this pattern in the strat strategy in several ways:
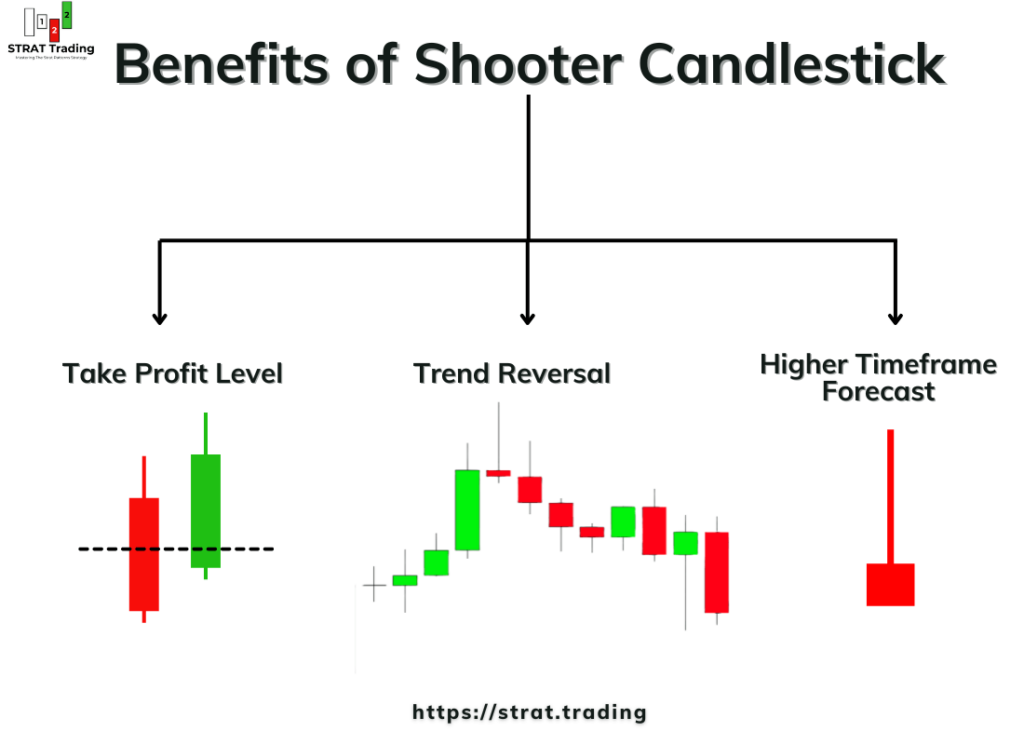
Holding or closing a trade: When a shooter candlestick forms during a bullish trend, you should wait until the price breaks the high or low of the shooter. On the bullish trade, if the price breaks the low of a shooter, then close the buy trade. However, if the price breaks the high, then keep on holding the buy trade.
To spot a reversal: In the 2-2 reversal pattern, we use the shooter candlestick to find a trend reversal from bullish to bearish. When a 2-2 reversal pattern forms on the higher timeframe, we can trade on the lower timeframe using the strat enforce patterns in a bearish direction.
Examples
I have taken some screenshots of the GBPJPY currency pair showing the usage of shooter candlestick in trading.
Below is the example of holding a buy trade until price breaks the low of shooter candlestick. This is not relevant here but it will help a lot in the strat patterns strategy.
The bottom line
The shooter candlestick is the most important pattern to look for when starting to trade to find a clear trend reversal in the market.
You should also understand the importance of the shooter pattern’s location on the chart. If it forms during overbought conditions, the probability of trend reversal will be high. However, if this pattern forms in ranging or choppy market conditions, it has no value.
Now it’s your turn. Take at least 50 screenshots of the shooter pattern and analyze them one by one. This practical activity will greatly improve your trading.
Please comment below if you have any questions about the shooter candlestick pattern.
Thanks