Introduction
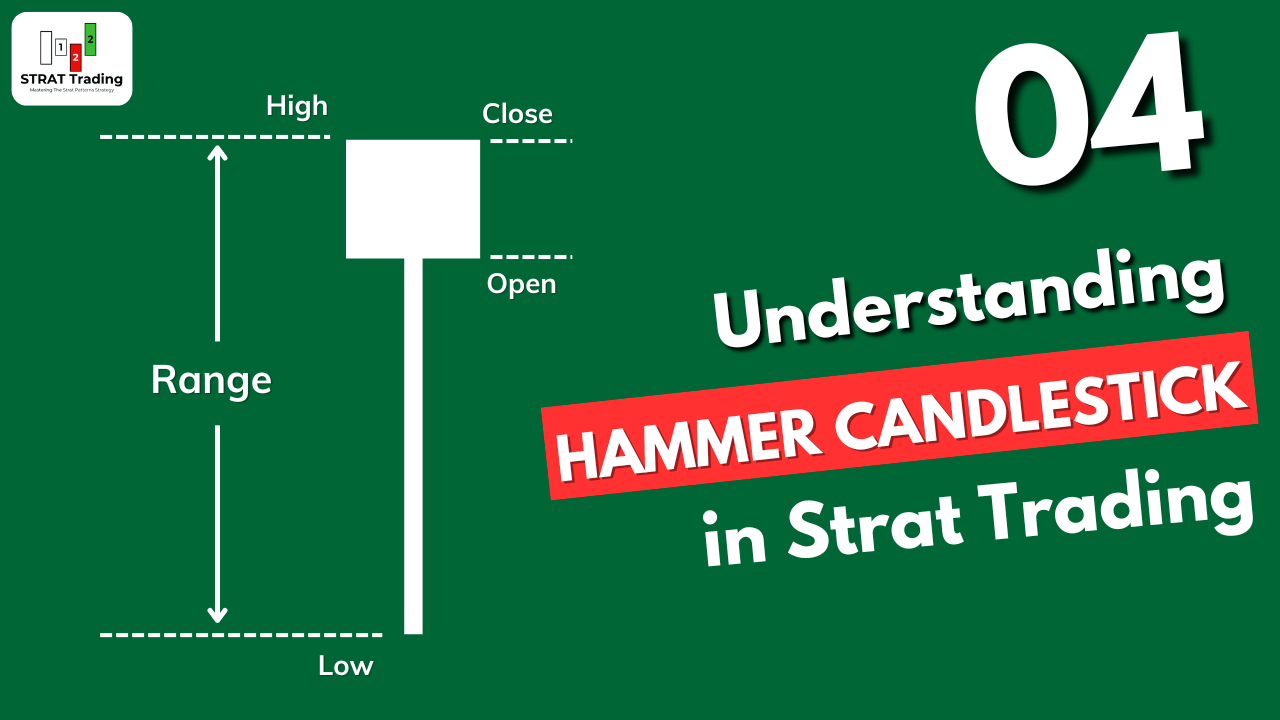
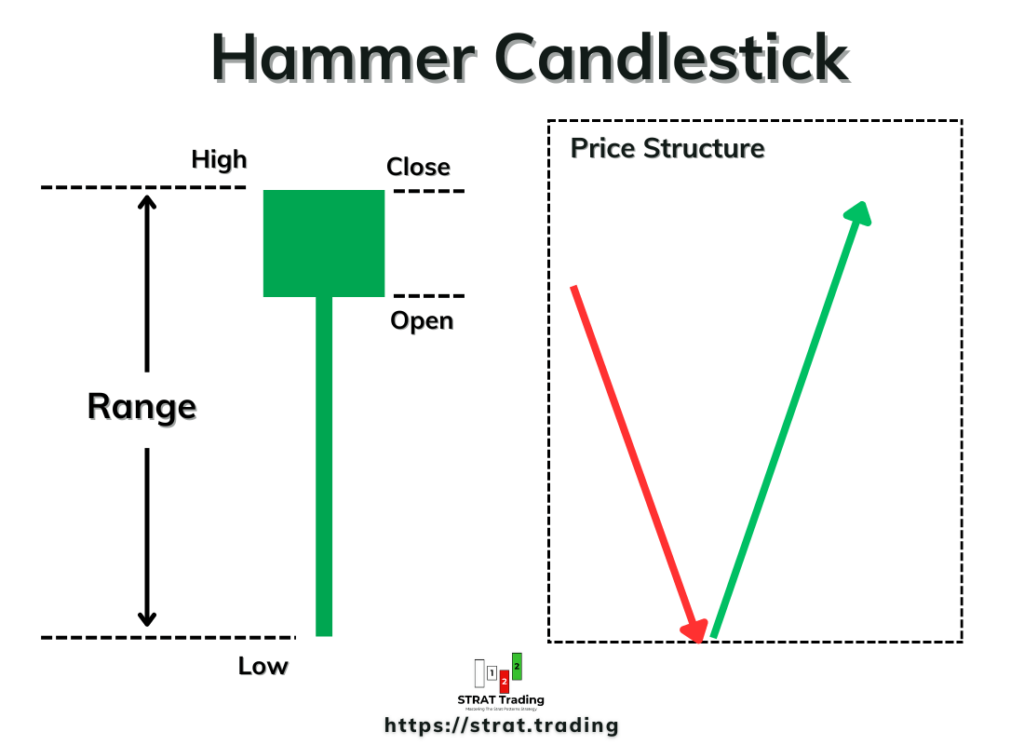
Hammer is a candlestick Pattern in which a small body forms at the upper end of the candlestick’s range with a long lower shadow/wick at least three times the length of the body. It is a bullish reversal candlestick pattern. After the formation of the hammer candlestick at the end of the downtrend, the price will change the trend from bearish to bullish.
The hammer candlestick pattern is used as an actionable signal in the strat patterns.
In this article, I will explain how to find the hammer candlestick on the chart and market psychology during the formation of this pattern. In the upcoming lessons, I will also explain how to use it as an actionable signal in the strat trading; however, at this point, you must focus on learning or improving your basics for the hammer candlestick pattern.
How do you find the hammer candlestick on a chart?
To find the hammer candlestick on the price chart, you should look for the following characteristics in a candlestick:
Prior trend: Before the hammer candlestick, the previous trend should be bearish, and the hammer should form at the end of the downtrend. It also represents the exhaustion of sellers in the market.
Small body at upper end: The body of candlestick should form in the upper 30% of the total range of candlestick. The body size should be small, and the colour of the body can be green or red. Colour does not matter during hammer candlestick formation, but the sense or opening/closing prices matter in the hammer pattern.
Long lower shadow: A Long lower shadow should form below the candlestick’s body. Its length should be greater than twice the size of the body (at least). This indicates that sellers tried to push the price below, but buyers were strong enough to make the price higher again.
Small upper shadow: A hammer candlestick can have a small or no upper shadow. Usually, a little shadow also forms practically on the trading chart above the body.
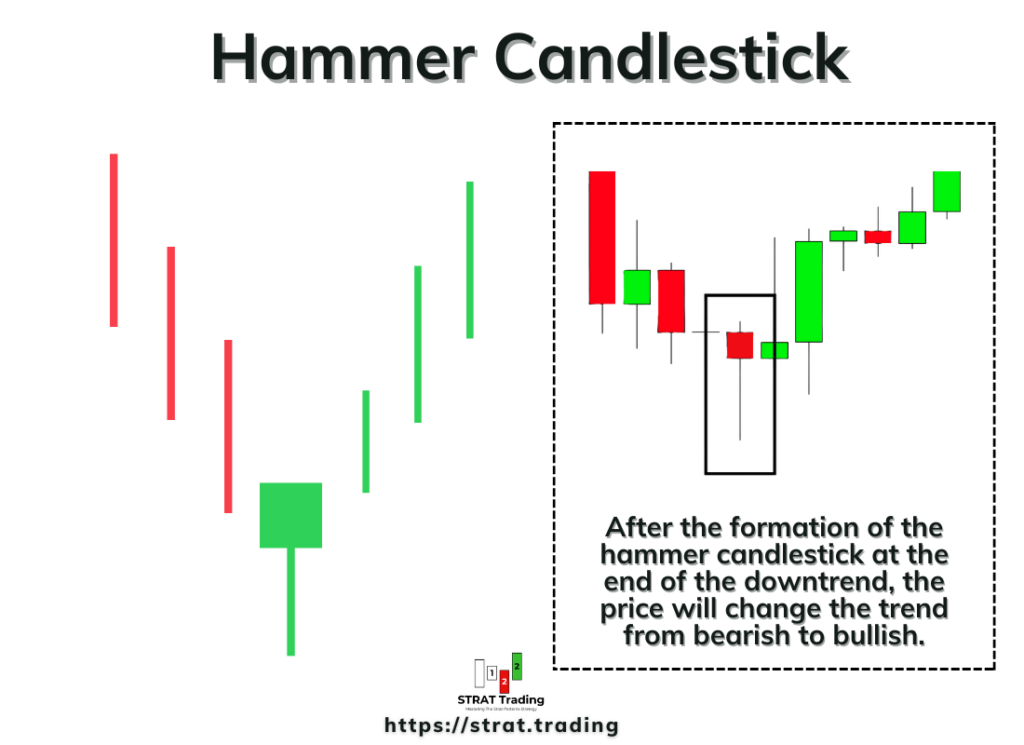
If you find these four characteristics in a candlestick, then it will be a hammer candlestick pattern, indicating a trend reversal from bearish to bullish.
The psychology behind the formation of hammer candlestick
As retail traders, we are not physically in the market; we only use charts to know the current or previous market price. That’s why we can’t judge the environment of the market directly. We’ll try to find the market environment only by looking at the chart’s price behaviour and price patterns.
The market environment consists of buyers and sellers and their activity in the market.
Now let me explain the psychology behind the formation of hammer candlestick. Then, it will become easier for you to know the activity of the actual market.
First, when the market opens, sellers continue decreasing the price. The trend was already bearish, and sellers were also Exhausted. Then buyers come into the market and increase the price to the market opening price. This process gives rise to forming a long lower shadow, showing that buyers are strong at this level and are now ready to increase the price.
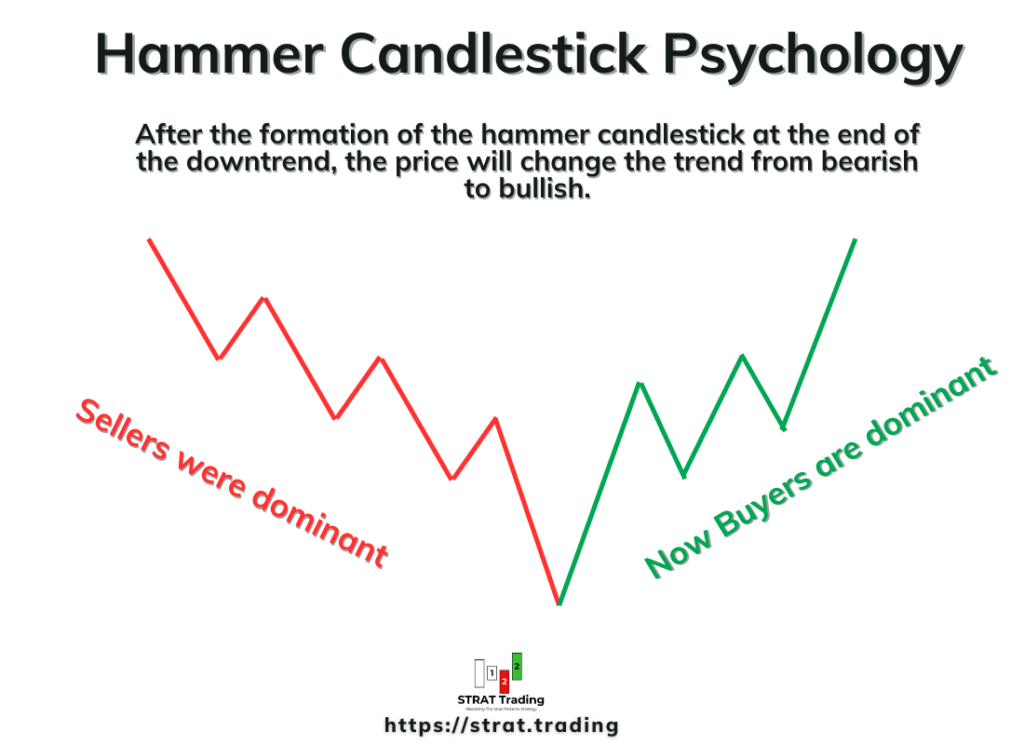
Once the next candlestick closes above the hammer candle, buyers are more confident to buy more because this is a bullish signal. Then, more buying activity occurs in the market, and it leads to a trend reversal.
How do you use the hammer in strat patterns trading?
Now, you’ll be able to find the hammer candlestick on the chart. However, the next step is to learn how to use it in strat patterns.
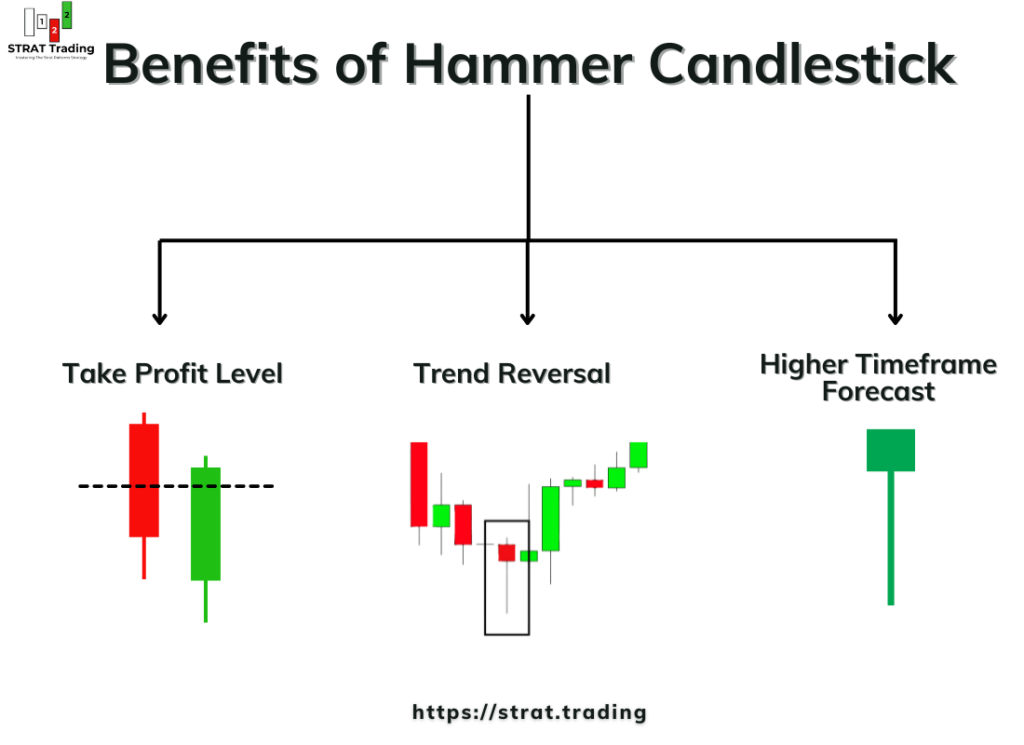
In the strat trading, we will use the hammer candlestick in the following:
Closing or holding a trade longer. For example, if we’re holding a bearish trade, then a hammer candlestick forms at the end of a trend. Then, upon confirmation of the price closing above the hammer candlestick, we’ll close the profitable trade. So it helps to find the take profit level.
To spot a reversal. We will primarily use it in the 2-2 reversal pattern to find the trend reversals in the market. In the upcoming lessons, I will teach you about the 2-2 or other reversal patterns.
Forecast on higher timeframes. If you find the hammer candlestick on higher timeframes, like daily, weekly, or monthly, then it means a big trend reversal will occur in the lower timeframes.
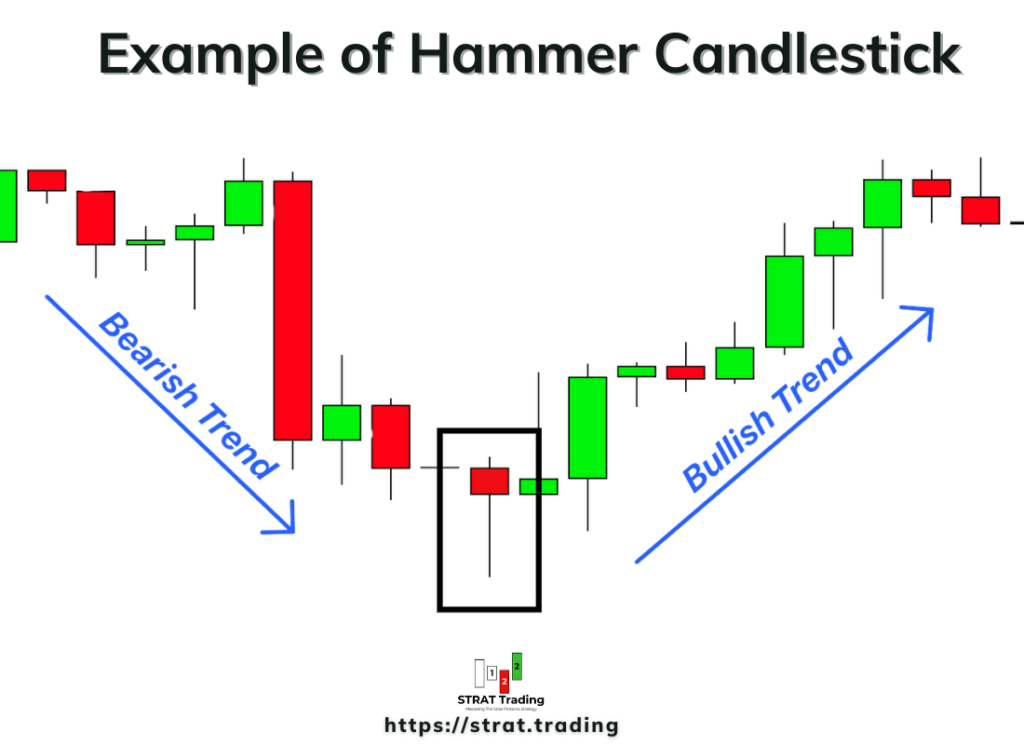
Example
Here is an example of a Hammer candlestick on the EURJPY chart with a 4-hour timeframe. Each candlestick before the hammer is making a new lower low, representing a bearish trend in the market. At the end of a bearish trend, a long lower shadow forms, showing that sellers have used their full power, and then buyers enter the market and increase the price close to the opening price, showing a formation of a hammer candlestick pattern on the chart.
The bottom line
The hammer candlestick is a valuable pattern to confirm a trend reversal in the market, especially in the start patterns Trading; we’ll use this pattern as a 2-2 pattern to confirm a trend reversal. The long lower shadow shows sellers’ tiredness and buyers’ entry into the market, suggesting a clear shift from a bearish trend to a bullish one.
Now, your task is to backtest this candlestick at least 50 times on the chart and take a screenshot of each pattern. Then, at the end, analyze those screenshots one by one. This will improve your trading a lot.
If you have any questions about the hammer candlestick pattern, kindly ask in the comments below. I will be happy to answer your questions.
Thanks